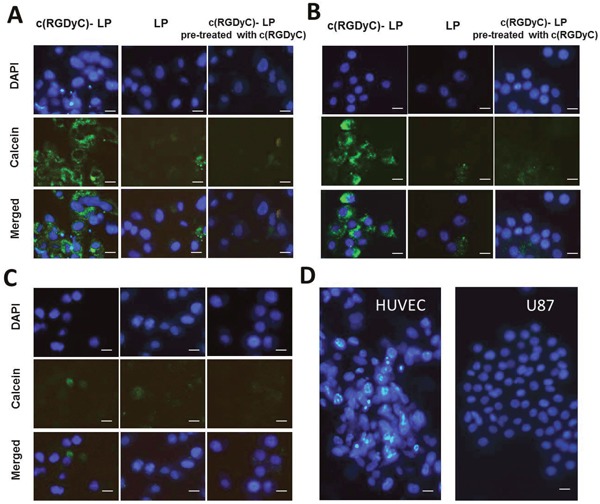
Figure 4. Representative fluorescence images showing selective cellular uptake of c(RGDyC)-LP corresponding to the expression of integrin αvβ3, which inhibited by pre-saturation with free c(RGDyC).

In integrin αvβ3-positive HUVEC (A) and U87 cells (B), c(RGDyC)-LP uptake is significantly higher than LP. No differential uptake was observed in integrin αvβ3-negative MIA PaCa-2 cells (C). Cell aggregation was observed in c(RGDyC)-LP treated or c(RGDyC) pre-treated HUVEC and U87 cells (D). DAPI was used to stain the nuclei (blue) and 10 mM calcein (green) was encapsulated in liposomes. Scale bar represents 10 μm. Cellular uptake of liposomes was recorded by fluorescence microscopy.
