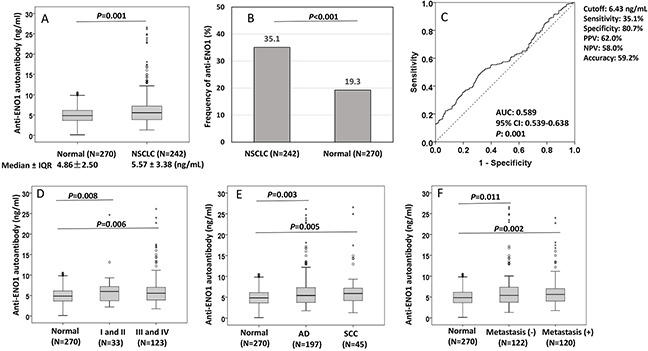
Figure 2. Distribution and ROC analysis of anti-ENO1 antibody in sera from patients with NSCLC and normal control individuals.

(A, D-F) Comparison of autoantibody level of anti-ENO1 in NSCLC patients and subgroups (stage, histology and metastasis) compared to normal individuals. Box and Whisker plots for serum level of anti-ENO1 in patients and normal individuals. The line within the box marks the median, and the 25th and 75th percentiles are presented by the edges of the area, which is known as inter-quartile range (IQR). The bars indicate 1.5 times of the IQR from upper or lower percentiles. P: Mann-Whitney test. (B) Frequency of anti-ENO1 autoantibody in NSCLC patients and normal individuals. P: χ2 test. (C): ROC curve of autoantibody to ENO1.
