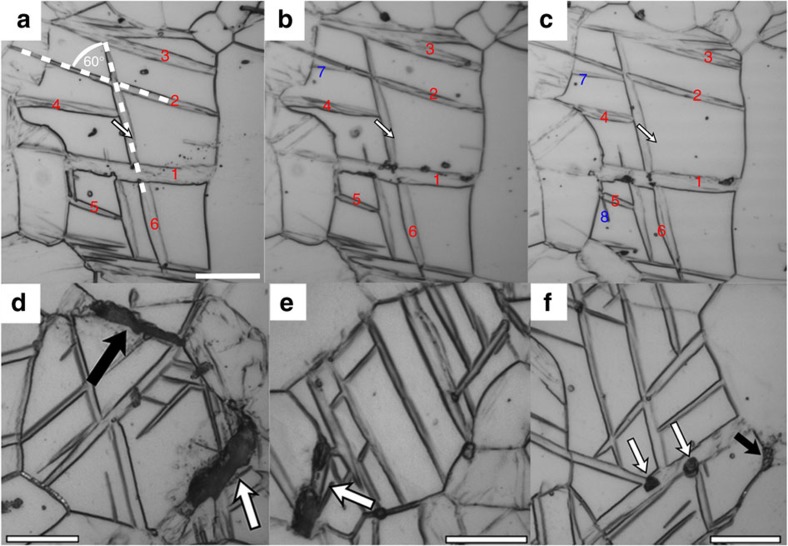
Figure 4. 3D structure of contraction twin networks.
Micrographs illustrating the 3D structure of the contraction twin network (a–c) and sites of crack and void formation (d–f). The 3D contraction twin network is generated through the formation of several CTW variants, which are subsequently overtaken by internal TTWs. Crack formation occurs at grain boundaries (black arrows), contraction twins or twin intersections (white arrows). Numbers given in (a–c) label specific contraction twin lamellae to facilitate their identification after serial sectioning. Red numbers denote twins, which were observed in all sections, while blue numbers denote twins, which were not observed initially, but during consecutive sectioning. Hence, the latter twins do not cross the entire grain. The 3D structure as well as the crack and void formation were evaluated in 10 grains using serial sectioning, while intersecting contraction twins and contraction twin networks were observed in hundreds of grains using conventional optical microscopy. Scale bar, 20 μm.

