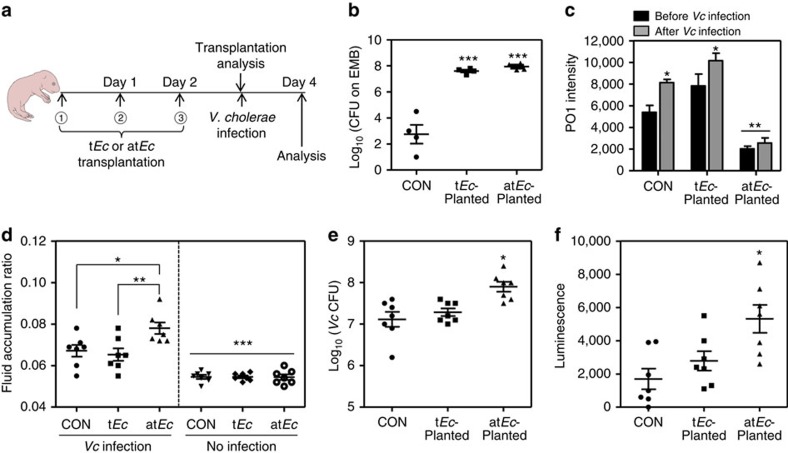
Figure 4. Infant mice transplanted with atEc exhibit increased susceptibility to Vc infection.
(a) Schematic diagram of the experimental procedure. Five-day-old infant mice were orogastrically transplanted three times with either the atEc or tEc strain (107 cells). On day 3 post-transplant, mice were infected with 106 N16961 cells. (b) To assess the transplantation efficiency, a subset of the mice in each group (n=4) were killed and intestinal tissue homogenates were obtained. These homogenates were inoculated into EMB medium to determine the number of ingested bacterial cells. Values are expressed as means±s.e.m. and are displayed on a log scale. ***P<0.001 versus the number of bacterial colonies from the control group. (c) Mouse intestinal tissue lysates obtained from each group (n=4) were stained with 100 μM PO1 for 30 min to detect ROS. Values are expressed as means±s.e.m. and are displayed in each bar. *P<0.05 versus PO1 signals from the ‘before Vc infection’ groups. **P<0.01 versus the signals of all the other groups. (d) Each group of mice was challenged with Vc (n=7, left panel) or left uninfected (n=7, right panel). The fluid accumulation (FA) ratio of each group was measured and plotted on a linear scale. *P<0.05 versus the FA ratio of the Vc-infected control group. **P<0.01 versus the FA ratio of the Vc-infected tEc-transplanted mice. *** indicates the FA ratios of the noninfected groups were significantly different from those of all Vc-infected groups (P<0.005). (e) The number of Vc cells that colonized the mouse intestine (n=7 in each group) was determined by CFU counting. Values are expressed as means±s.e.m. and are displayed on a log scale. *P<0.05 versus Vc CFUs of the control or tEc-transplanted group. (f) Infant mice (n=7 per group) were infected with a Vc ctxAB promoter fusion reporter strain. The level of bioluminescence was measured in each mouse intestinal tissue homogenate. Values are expressed as means±s.e.m. and are displayed on a linear scale. *P<0.05 versus the bioluminescence level in control mice.

