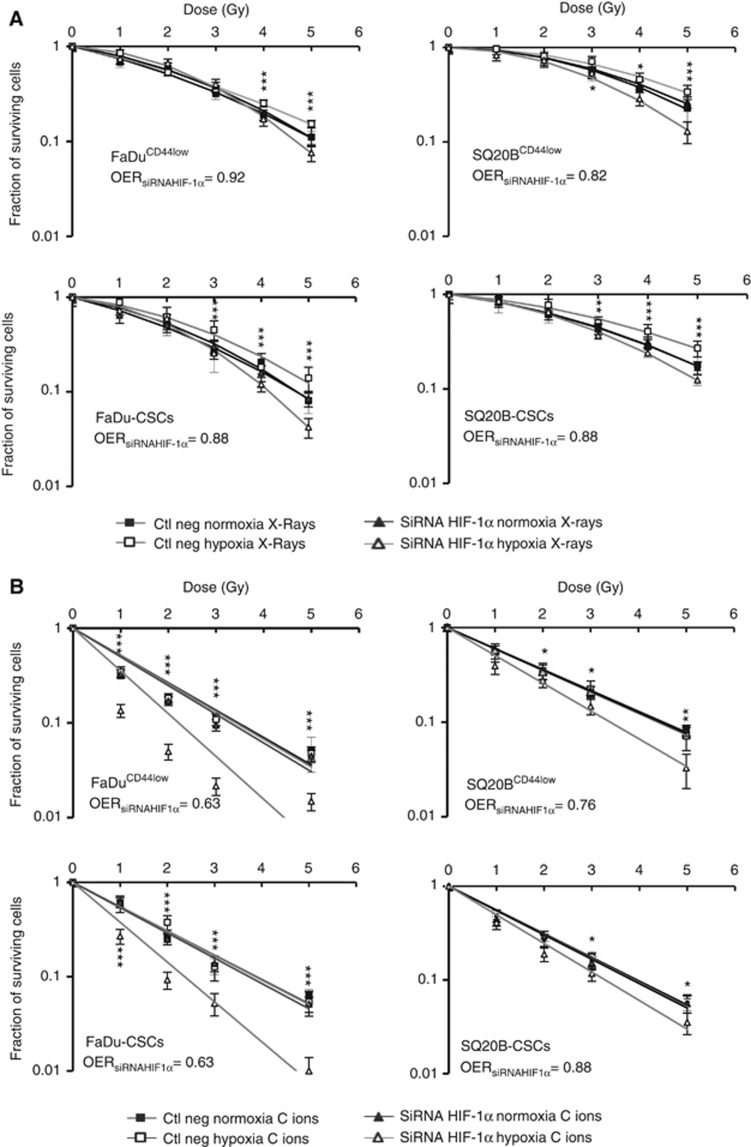
Figure 3.
Clonogenic survival curves after cell transfection with a siRNA targeting HIF-1α or an irrelevant siRNA. FaDuCD44low, SQ20BCD44low, FaDu-CSCs and SQ20B-CSCs cell lines were transfected with the siRNA of interest and exposed to photons (A) or carbon ions (B) in normoxic or hypoxic conditions. Square and triangle plots represent respectively the negative control and the siRNA survival fraction. Black plots are for normoxia and open plots for hypoxia. Values represent the mean±s.d. of two independent experiments performed in sextuplicate. Student’s t-test was performed between the survival fractions of ctl neg hypoxia and siRNA HIF-1α hypoxia curves for each cell lines (*P<0.05, **P<0.01 and ***P<0.005). The OER was calculated at 10% of surviving cells for both the cell lines transfected with the siRNA HIF-1α.

