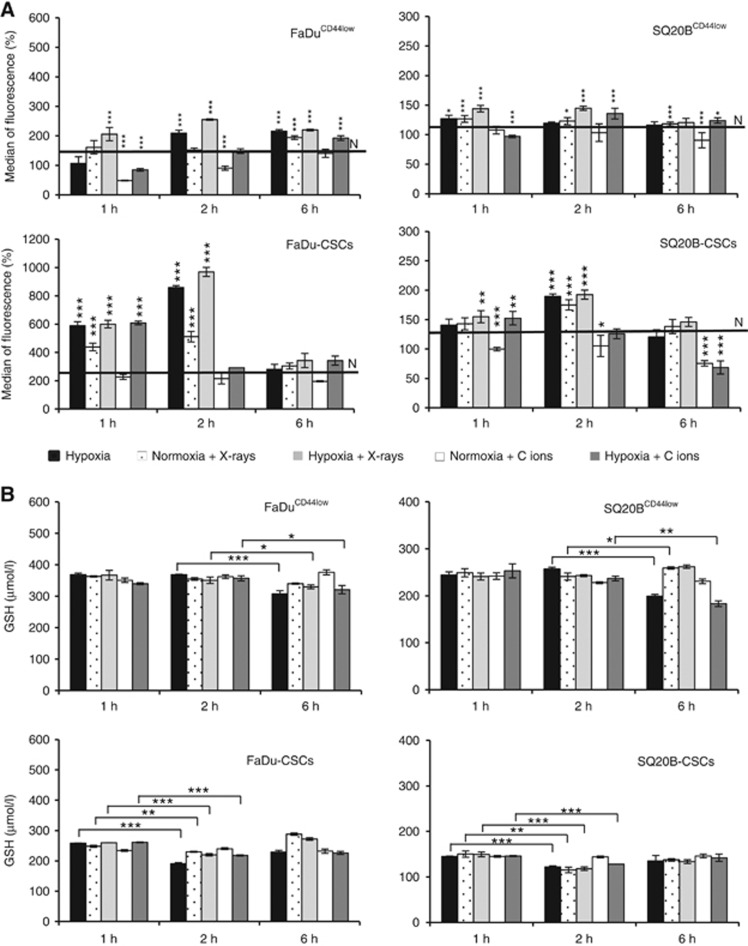
Figure 4.
Evaluation of the REDOX status. FaDuCD44low, SQ20BCD44low, FaDu-CSCs and SQ20B-CSCs cell lines were cultured under hypoxia or normoxia (black line N) after photon or carbon ion exposure. (A) Relative increase of the ROS production at the key times points corresponding to HIF-1α expression, compared to normoxia (N). (B) Reduced glutathione concentrations were quantified by HPLC-SM and were represented for the four populations of HNSCC studied. Values represent the mean±s.d. of three (A) and two (B) independent experiments performed in triplicate. A student’s t-test was performed for A values (between ROS of interest and reference value under normoxia) and for B (between GSH concentrations at 2 and 6 h for non-CSCs and 1 and 2 h for CSCs). *P<0.05; **P<0.01 and ***P<0.005.

