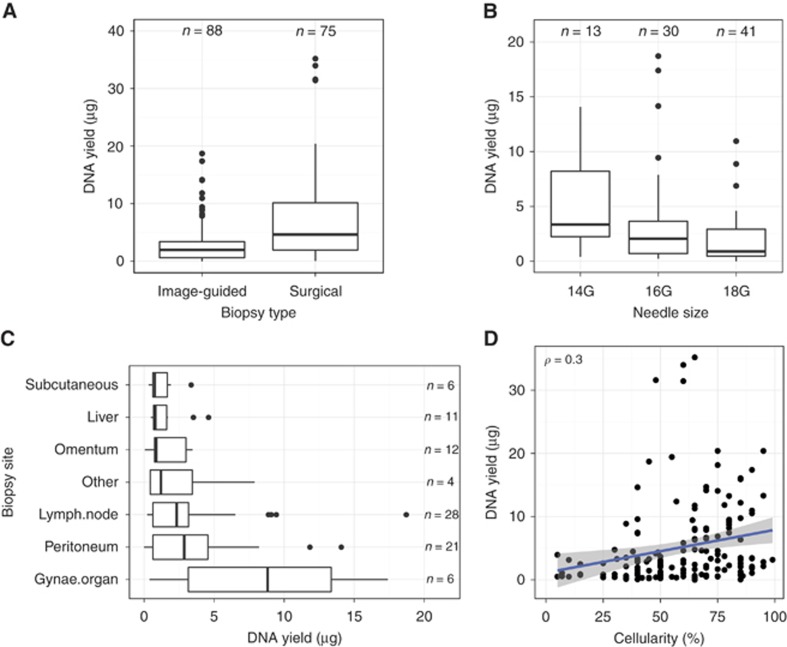
Figure 2.
DNA yields.(A) DNA yield in image-guided and surgical biopsies. ****P<0.0001. (B) DNA yield was significantly greater in image-guided biopsies using 14 G or 16 G needles compared to 18 G. **P=0.0022. (C) DNA yields according to anatomical site of biopsy for image-guided procedures. (D) Correlation between DNA yield and tumour cellularity. Number represents Spearman rank correlation coefficient ρ. P<<0.001. Line represents linear regression ± 95% CI.

