Figure 3.
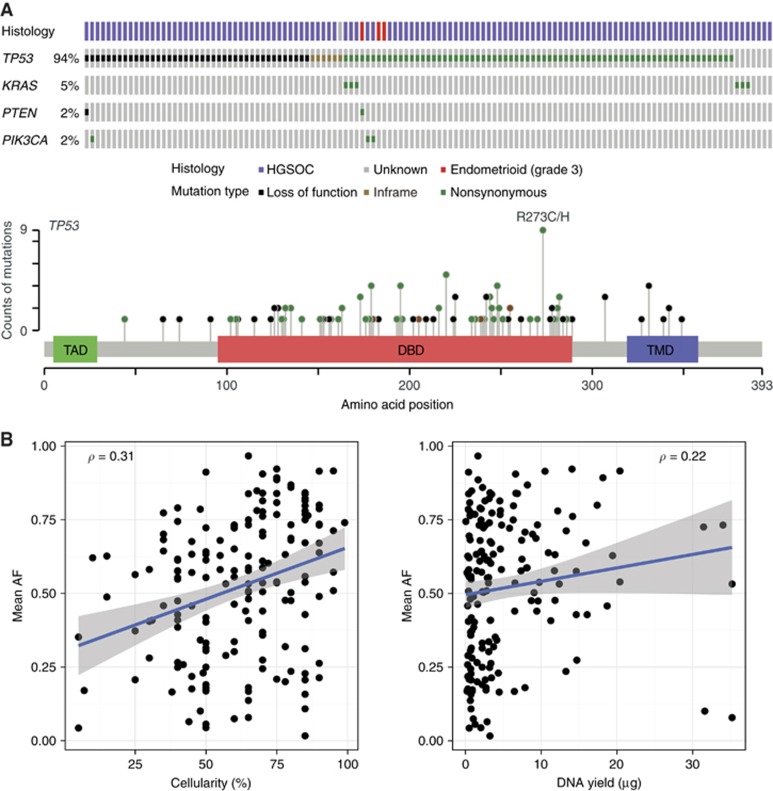
Mutation analysis.(A) Mutations in TP53, KRAS, PIK3CA and PTEN identified in 125 patients by tagged amplicon sequencing with histological subtype (upper). No mutations in EGFR or BRAF were identified in any sample (Cerami et al, 2012; Gao et al, 2013). Schematic representation of p53 (lower) showing protein domains (Green, transactivation domain; red, DNA binding domain; blue, tetramerisation domain) with lollipops showing positions and counts of identified mutations. Mutation type is indicated by circle fill: black, loss of function (including nonsense, splicing and frameshift); brown, inframe indels; green, nonsynonymous. (B) Correlation between cellularity in dissected areas and TP53 mutant allele fraction (MAF)—left, (P<<0.001), and between DNA yield and TP53 mutant allele fraction—right, (P=0.0034). Numbers represent Spearman rank correlation coefficient ρ. Lines represent linear regression ± 95% CI.

