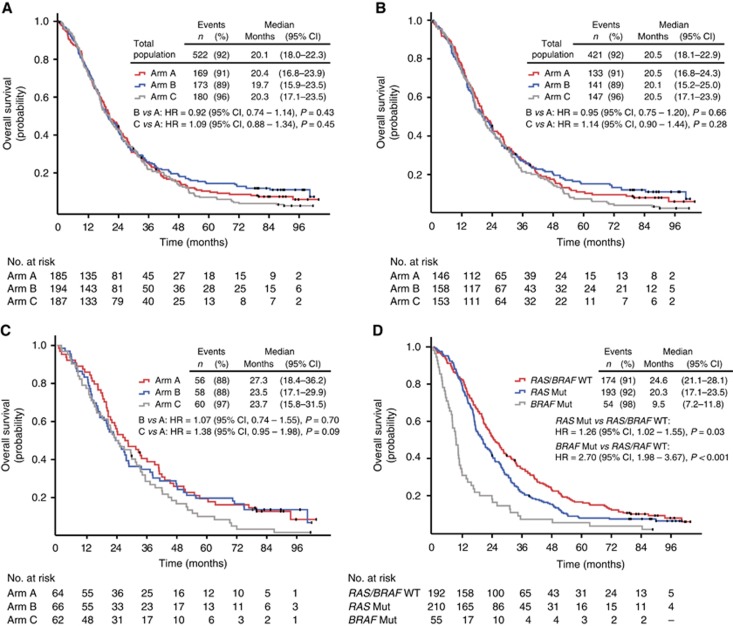
Figure 2.
Survival curves. Overall survival in the three different treatment arms: (A) intention-to-treat population; (B) RAS- and BRAF-tested population; and (C) RAS and BRAF wild-type population. (D) Overall survival in patients with RAS and BRAF wild-type, RAS mutant, and BRAF-mutated tumours. CI=confidence interval; HR=hazard ratio; Mut=mutation; WT=wild-type.

