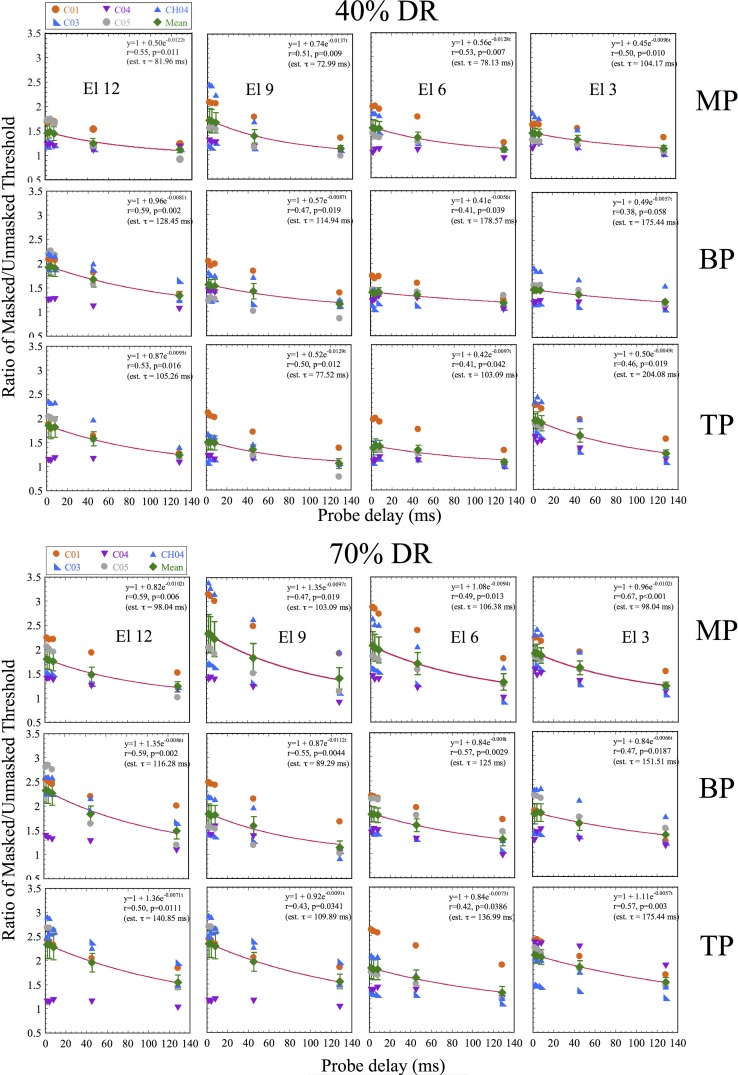
FIG. 2.
(Color online) Masking levels vs probe delay, as in Fig. 1, but for Advanced BionicsTM device users. From left to right, panels show results obtained with electrodes from base to apex. From top to bottom, results are shown for stimulation in MP, BP, and TP mode. The top half shows results obtained with 40% DR maskers and the bottom half shows results obtained with 70% DR maskers. Lines show exponential fits to the pooled data as in Fig. 1, and insets show fit parameters and estimated time constants.

