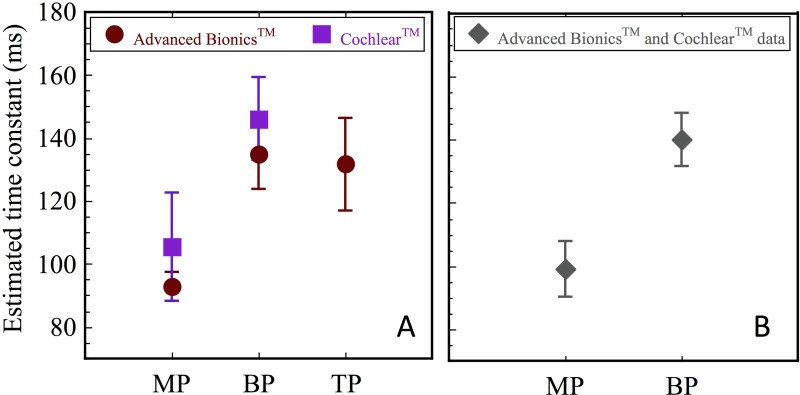
FIG. 3.
(Color online) (A) Mean estimated time constants calculated across electrodes and subjects, for stimulation in the different modes. Error bars show +/− 1 s.e. Results obtained with CochlearTM and Advanced BionicsTM devices are shown in squares and circles, respectively. (B) Mean estimated time constants calculated across electrodes, levels, and subjects for stimulation in MP and BP mode: combined data from CochlearTM and Advanced BionicsTM users combined. Error bars show +/− 1 s.e.

