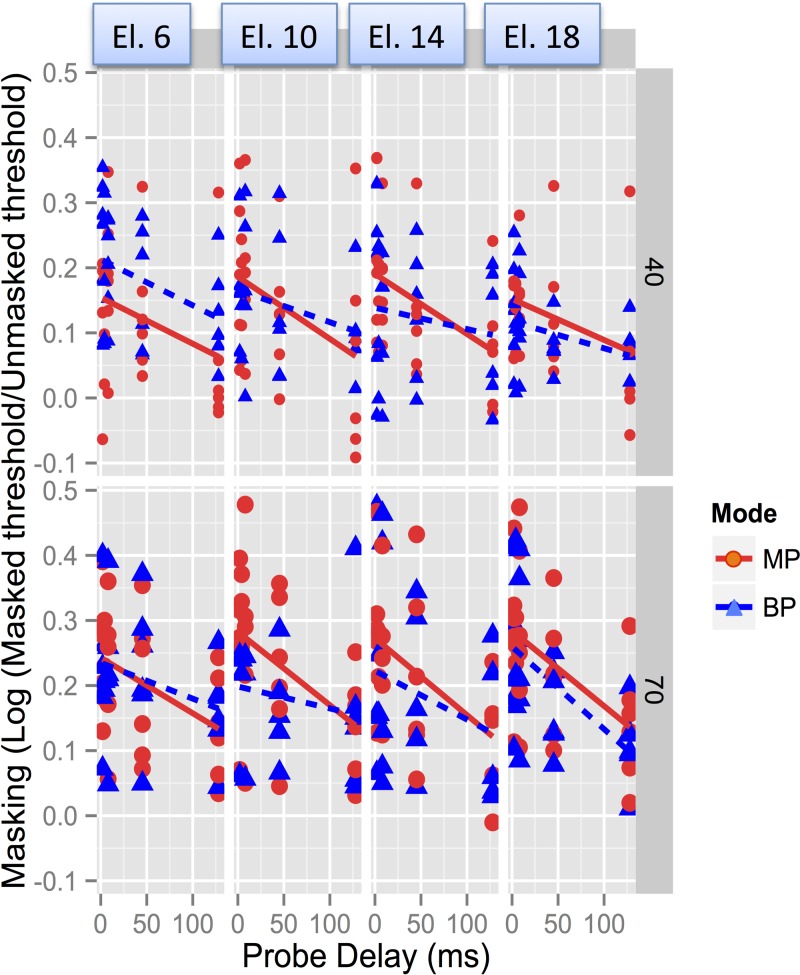
FIG. 4.
(Color online) Data obtained with CochlearTM devices, plotted as log (Tm/T0) against linear delay in ms. The top and bottom panels show results obtained at 40% and 70% DR levels, respectively. From left to right, the plots show results with the four electrodes from base to apex. Circles and triangles correspond to MP and BP stimulation modes, respectively.

