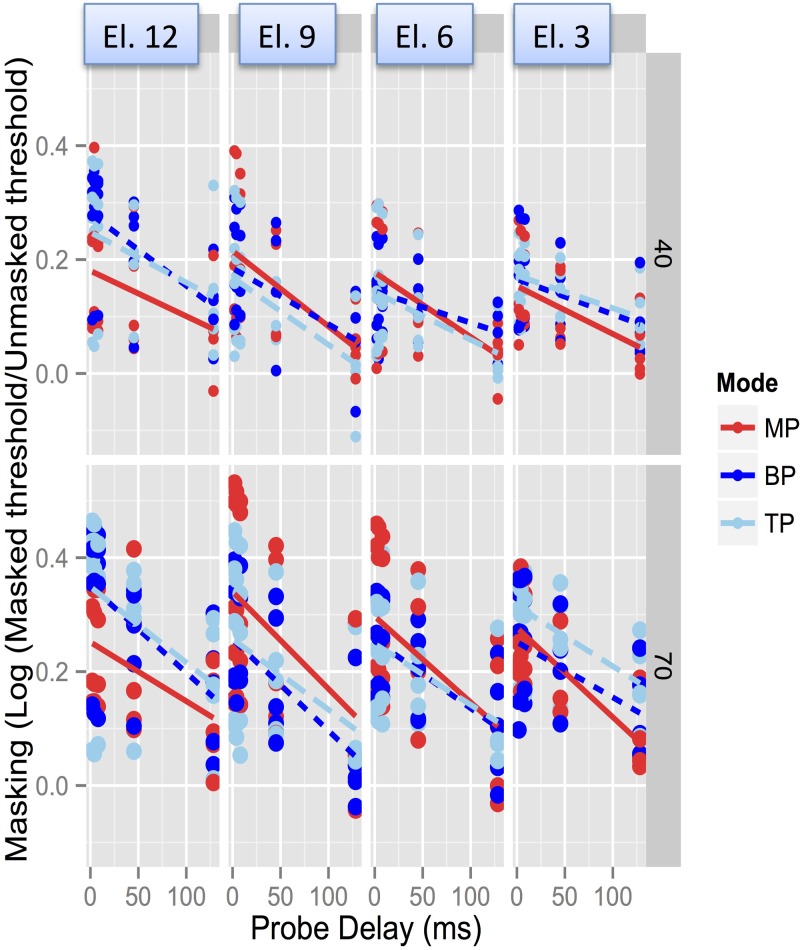
FIG. 5.
(Color online) Similar to Fig. 4, but with data obtained in Advanced BionicsTM users, log Tm/T0 vs Delay for 40% and 70% DR (top and bottom), and each of the four electrodes (basal to apical, left to right). Lines show linear regression, shaded areas show confidence intervals. MP, BP, and TP data are shown in circles, triangles, and squares, respectively.

