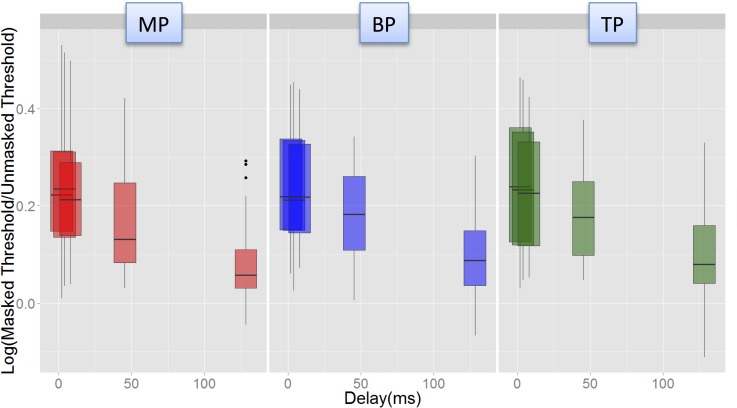
FIG. 9.
(Color online) Illustration of the Delay-Mode interaction in the Advanced BionicsTM data. Masking (log Tm/T0) vs Delay plotted for each of the three modes (left to right). Data were pooled across electrodes and levels. Steeper recovery was observed between the two shortest delays and the 45 ms delay in MP mode, but not in the other modes.

