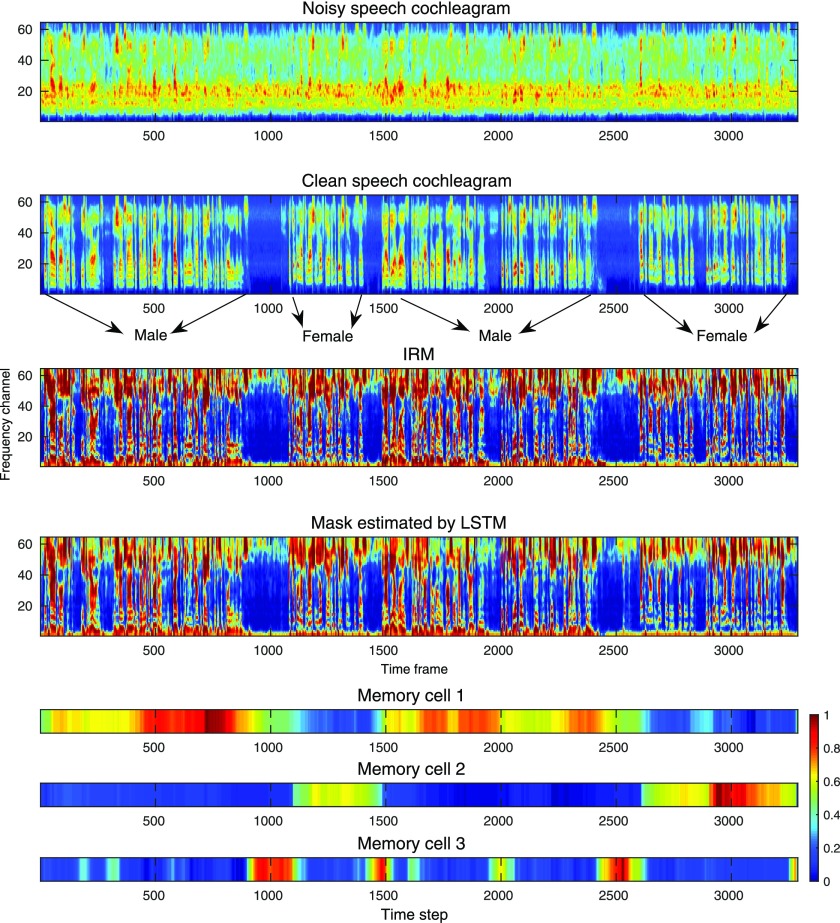
FIG. 9.
(Color online) Visualization of speech patterns and memory cell values. Four utterances of two unseen speakers (male and female) are concatenated and mixed with the unseen babble noise at 0 dB SNR. The top four plots depict noisy speech cochleagram, clean speech cochleagram, the IRM and the estimated mask by LSTM, respectively. The bottom three plots show values of three different cells across time, respectively.

