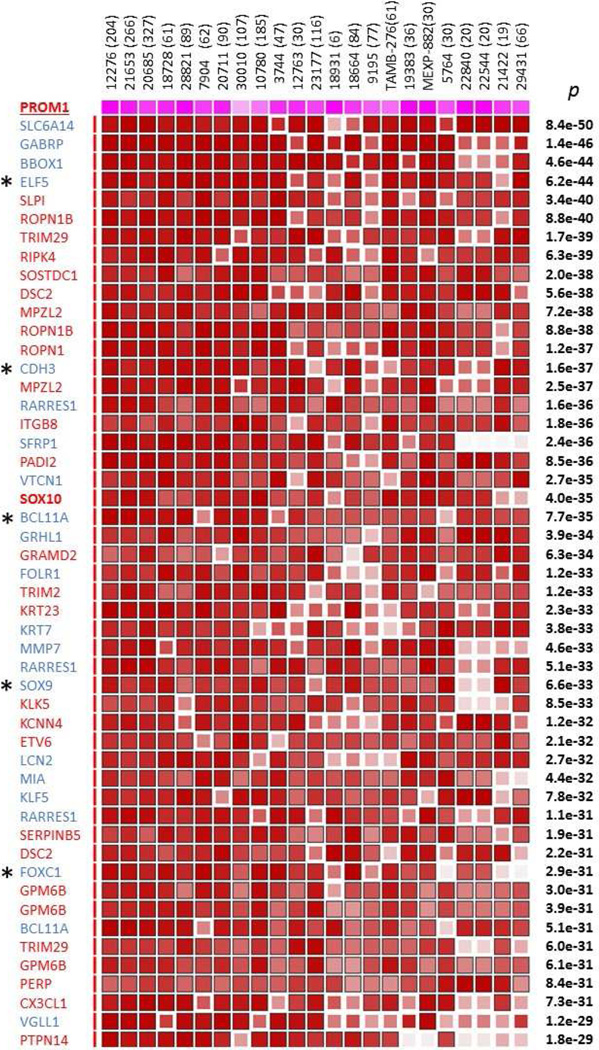
Figure 1. Top 44 genes ranked by their co-expression with PROM1 in Affymetrix U133 Plus 2.0 datasets using aggregation MEM meta-analysis.
Novel genes that we associated with BBC and SOX10 are shown in red font, while previously published BBC-intrinsic genes are in blue. All genes show highly statistically significant co-expression with PROM1 and each other (p values shown at the right edge of matrix). Some genes are represented by 2 or 3 probes. Dataset IDs and their sizes (in brackets) are shown on top. Dark brown color signifies highest ranks of association by co-expression. More information on how to read MEM output can be found at http://biit.cs.ut.ee/mem/help/help.html.

