
Figure 4.
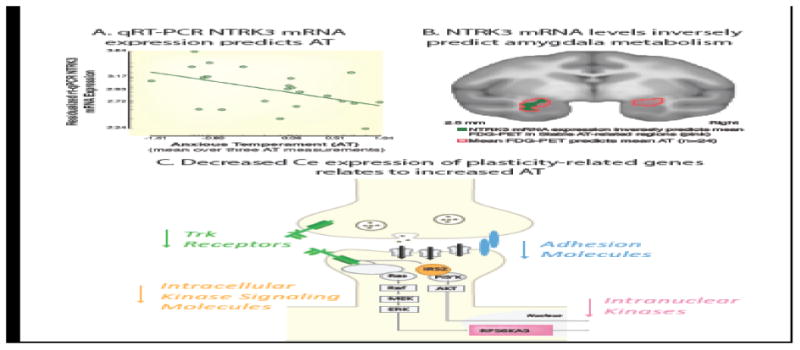
Ce expression of mRNA for the neurotrophic receptor, NTRK3, negatively predicts AT. (A) Microarray data showed that individuals with higher levels of Ce NTRK3 mRNA expression exhibited lower AT. Quantitative real-time reverse transcription polymerase chain reaction (qRT-PCR) confirmed the negative relationship between Ce NTRK3 mRNA expression levels and AT (r = - 0.49; P = 0.029). (B) Individuals showing higher levels of NTRK3 mRNA expression, indexed by qRT-PCR, show reduced amygdala metabolism in vivo (green) [FDR-corrected within the stable AT-related region (outlined in red)]. (C) Schematic of the neuroplasticity-associated NTRK3 (tropomyosin receptor kinase [Trk]) pathway. A similar pattern in relation to AT was found for IRS2, an intracellular kinase signaling molecule (orange) and RPS6KA3 (pink), two downstream mediators of NTRK3 activation. Other molecules in the NTRK3 pathway are also depicted in light gray. Adapted with permission from Fox et al. (2012) and from Fox & Kalin (2014).