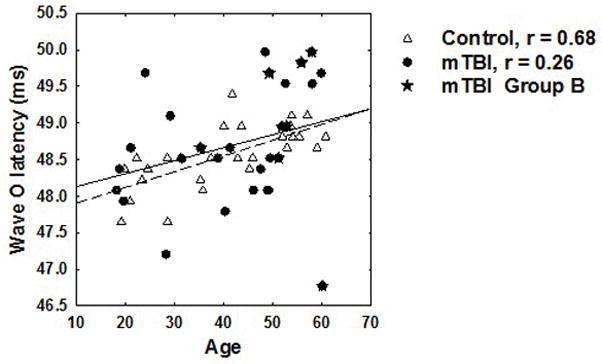
Figure 6.

Relationship between age and the latency of wave O (offset) of the speech-evoked ABR. Open triangles represent control subjects and the regression is shown as a dashed line. The solid line represents the regression for the mTBI subjects represented by filled symbols. The star symbols indicate the subjects in Group B with abnormal auditory performance. Correlation coefficients for each group are shown in the legend.
