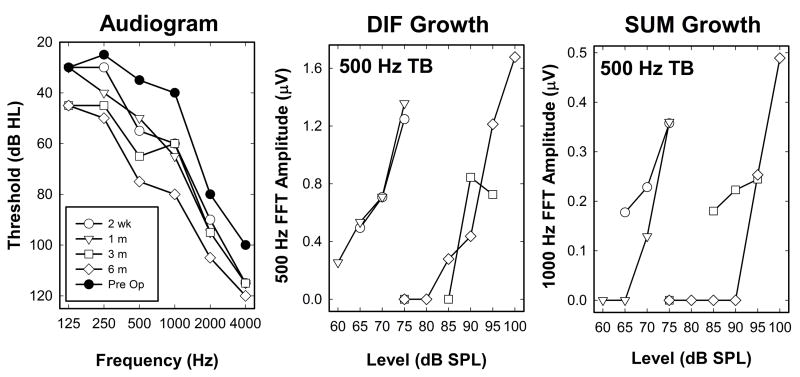
Figure 12.
These plots show an example of a series of recordings obtained from an individual study participant (T14R) who experienced a loss of hearing several months after implantation. The panel on the left shows audiometric thresholds plotted as a function of stimulus frequency both preoperatively and at several times after implantation. Initially there some hearing loss but by the 3 and 6 month visits the extent of the hearing loss was more severe. The plots on the right show growth functions constructed using the DIF and SUM responses at each of the four postoperative appointments.

