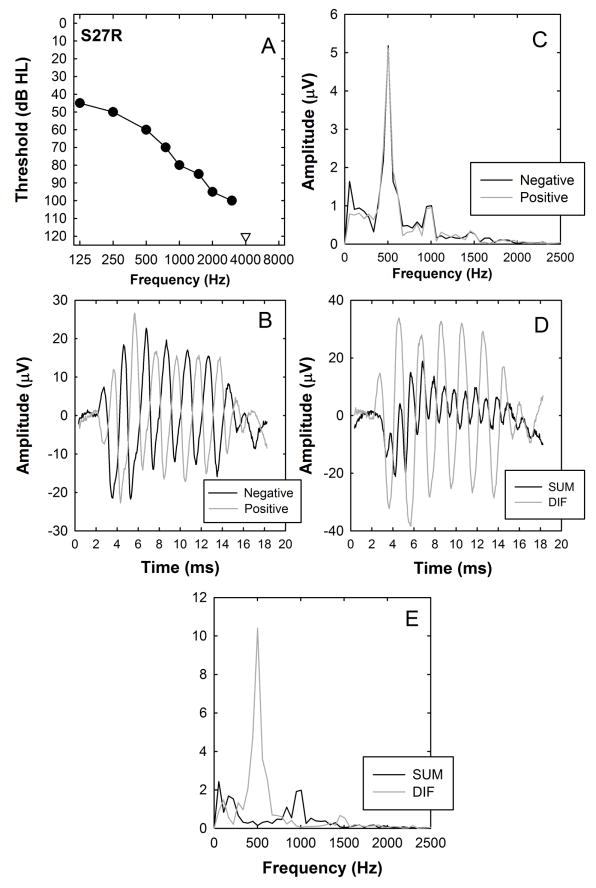
Figure 5.
An example of responses recorded using a 500-Hz tone burst. Panel A shows the audiogram measured at the time of evoked potential testing. Panel B shows the response to positive leading and negative leading tone bursts plotted as a function of time after stimulus onset. Panel C shows the results of fast Fourier transform analysis of the two time waveforms shown in panel B. The amplitude scale in this and subsequent figures indicates the amplitude of each frequency component of the transform (in μV) calculated using 376 time samples recorded at a rate of 20,000 samples/s. Panel D shows the sum of the positive and negative -leading traces (labeled SUM) which tends to enhance the neural response as well as the difference between positive and negative leading responses (labeled DIF) which tends to enhance the hair cell response. Panel E shows the results of a fast Fourier transform of the time waveforms shown in Panel D.

