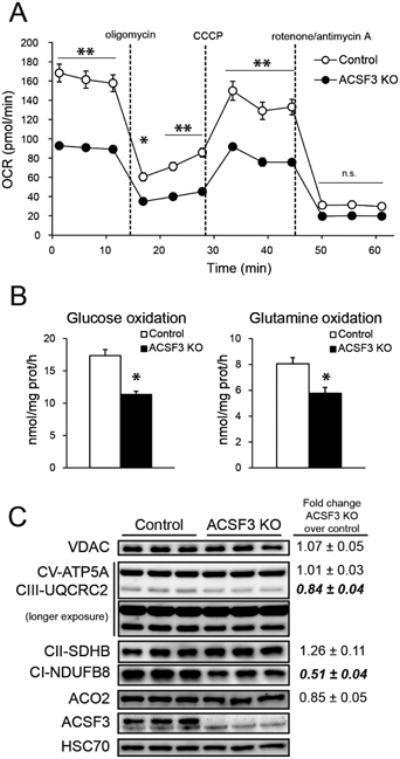
Figure 2. ACSF3 Regulates Mitochondrial Metabolic Efficiency.

(A) Oxygen consumption rate of ACSF3 KO cells in the presence of 10 mM glucose, 2 mM glutamine, and 1 mM pyruvate upon sequential administration of the specified mitochondrial inhibitors, normalized to cell number (mean ± SEM, n=5, representative of three independent experiments).
(B) Oxidation of [U-14C]D-glucose, [U-14C]L-glutamine, and [U-14C]L-alanine to 14CO2 in ACSF3 KO cells (mean ± SEM, n=6).
(C) Immunoblot of several mitochondrial proteins. VDAC (voltage-dependent anion channel 1) as outer mitochondrial membrane marker; ATP5A component of ATP synthase, Complex III subunit 2 (UQCRC2), SDHB subunit of Complex II, and NDUFB8 subunit of Complex I of the inner mitochondrial membrane; aconitase (ACO2) and ACSF3 of the mitochondrial matrix; and HSC70 as cytoplasmic loading control. Protein abundance was normalized to HSC70, and values shown are fold change proteinabundance in ACSF3 KO cells over control cells (mean ± SEM, n=5, p<0.05 are in bold).
*p<0.05, **p<0.001
