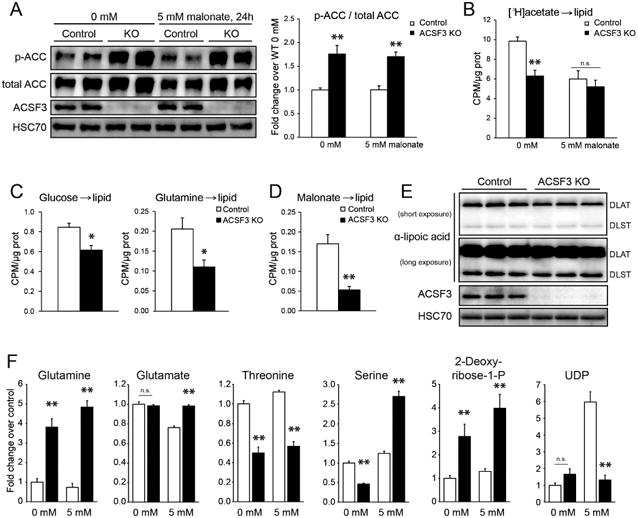
Figure 3. Metabolic Alterations in ACSF3-Deficient Cells.

(A) Acetyl-CoA carboxylase (ACC) phosphorylation (Ser79) in ACSF3 KO and control cells in the presence or absence of 5 mM malonate for 24 hours (mean ± SEM, n=6 from two independent experiments, **p<0.01 for genotypic effect, with no effect of malonate treatment, determined by posttest after two-way ANOVA). See also Figure S2.
(B) [3H]acetate incorporation into total cellular lipids in the presence or absence of malonate (5mM) (mean ± SEM, n=6, representative of two independent experiments, **p<0.01 for genotypic effect, malonate treatment effect p=0.001 with significant interaction (p<0.05), determined by two-way ANOVA). (CPM = counts per minute).
(C) [U-14C]glucose and [U-14C]glutamine incorporation into the total lipid fraction (mean ± SEM, n=6, *p<0.05).
(D) [2-14C]malonate into total cellular lipids (n=12, pooled from two independent experiments).
(E) Immunoblotting for lipoic acid-modified proteins, DLAT (E2 of pyruvate dehydrogenase) and DLST (E2 of α-ketoglutarate dehydrogenase), with HSC70 as loading control.
(F) Select metabolite levels in the presence or absence of 5 mM malonate for 24 hours (mean ± SEM, n=10, **p<0.01 by posttest after two-way ANOVA). More metabolites and two-way ANOVA results in Table S1.
