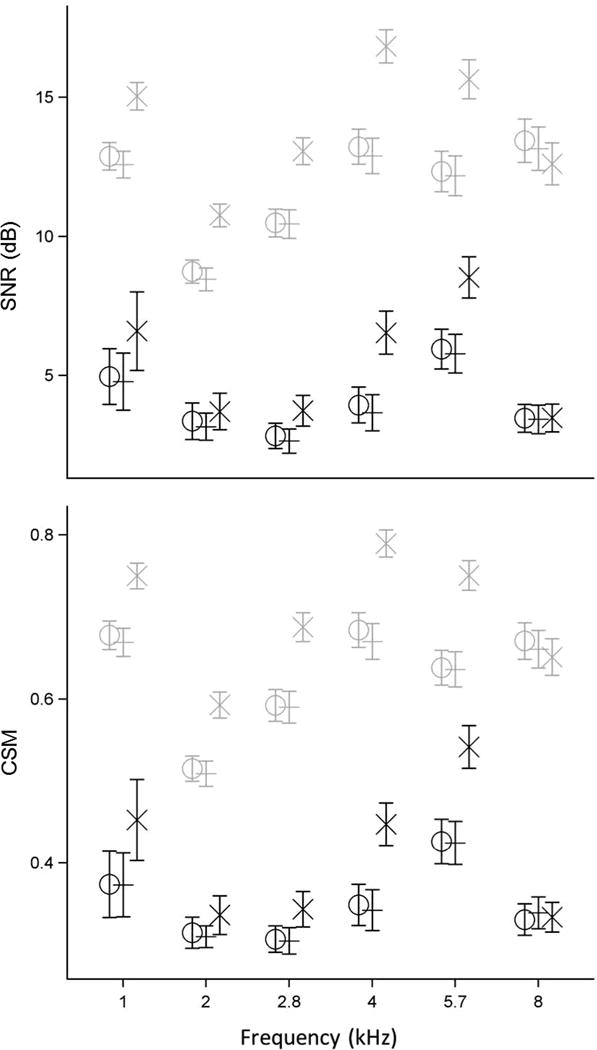
Figure 6.

The model-based mean estimate of TEOAE SNR (in dB, top panel) and CSM (bottom panel) at each half-octave frequency for ears with normal hearing (light gray) and SNHL (dark gray). Mean findings for the three TEOAE stimulus methods are plotted together at each frequency and staggered for clarity: Ambient (O), TPP (+), and Power Weighted (X). Error bars in both panels represent ±1 SE from the mean. Some data are slightly displaced horizontally to improve clarity.
