Figure 1.

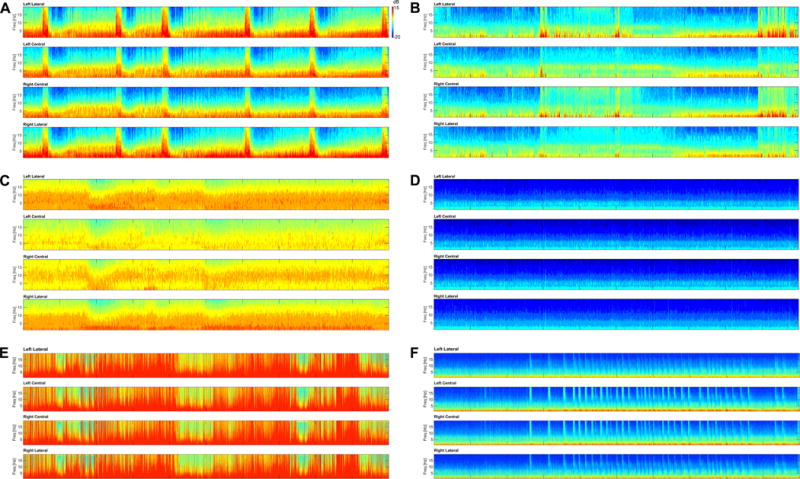
Representative images of the 5 categories, including the two artifact sub-categories that each CSA image was assigned to. The vertical axis represents the spectrogram frequency from 0–20 Hz, and the color bar indicates how the log-power (dB) of the frequency components is represented by colors in the spectrogram. The horizontal axis corresponds to 2-hours of time. All test images with their assigned categories are available as supplementary material for review. A. Solid Flame – Note the repeated appearance of regular, rectangular shaped “solid flames” associated with an abrupt increase in power and frequency with gradual frequency decrease (decrescendo). Each of the flames represents a brief nonconvulsive seizure, which were detected by participants with a high rate of accuracy. B. Irregular Flame – This image has several instances of abrupt, irregular increases in frequency and power consistent with the “irregular flame” pattern. There are no seizures present, but this image and others in this category were associated with a high rate of false-positive selections. C. Broadband/Monotonous – The first hour of this slide is monotonous with a broad, high-powered band at lower frequencies. This pattern waxes and wanes slightly in the second hour. Three prolonged nonconvulsive seizures were present in this image. D. Suppressed – This image, taken from a patient in burst-suppression without seizures, is monotonous with low power at all frequencies. E. Artifact (Massive) – This image shows irregular high-power signal that diffusely saturates all frequencies at nearly all time points. No seizures are present. F. Artifact (Stalactite) – Repeated muscle artifact appears to “rain down” from higher frequencies, and is superimposed on a monotonous, relatively suppressed background. No seizures are present.
