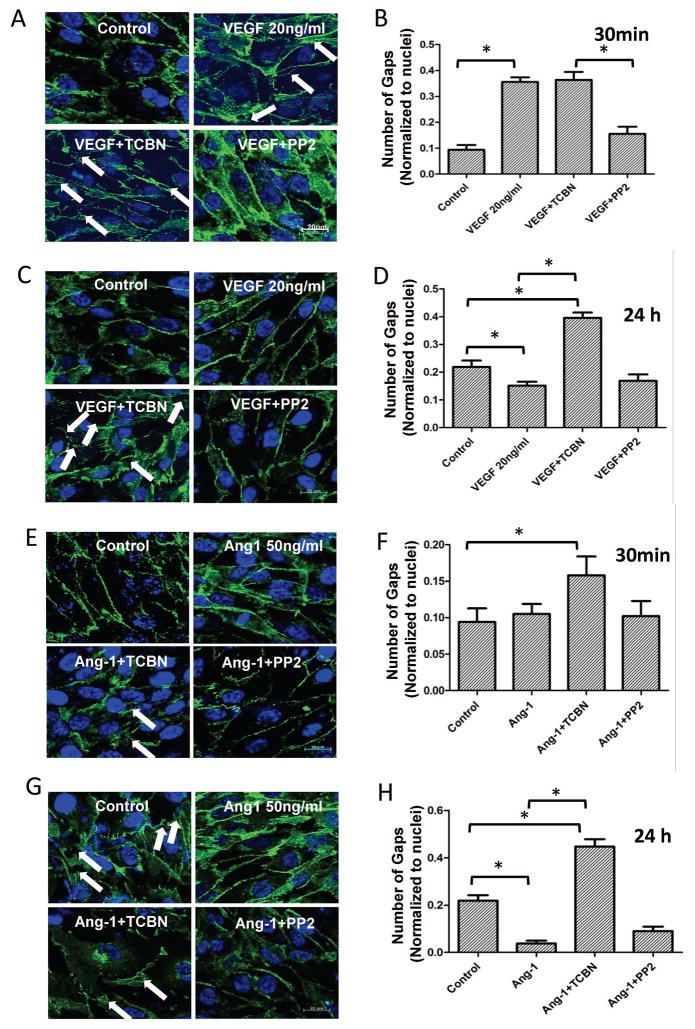
Figure 3. Inhibition of Akt, but not Src results in HMEC monolayer gap formation in the long-term.
(A–B) Representative confocal images and quantification of the gap number in VE-cadherin stained HMEC monolayers treated with 20 ng/ml VEGF in the presence and absence of Akt inhibitor TCBN or Src inhibitor pp2 for 30 minutes. (C–D) Representative confocal images and quantification of the gap number in VE-cadherin stained HMEC monolayers treated with 20 ng/ml VEGF in the presence and absence of Akt inhibitor TCBN or Src inhibitor pp2 for 24 hours. (E–F) Representative confocal images and quantification of the gap number in VE-cadherin stained HMEC monolayers treated with 50 ng/ml Ang-1 in the presence and absence of Akt inhibitor TCBN or Src inhibitor pp2 for 30 minutes. (G–H) Representative confocal images and quantification of the gap number in VE-cadherin stained HMEC monolayers treated with 50 ng/ml Ang-1 in the presence and absence of Akt inhibitor TCBN or Src inhibitor pp2 for 24 hours. Data are represented as mean ± SD. (n=4), *P<0.01, scale bar 20 μm.

