Fig. 13.

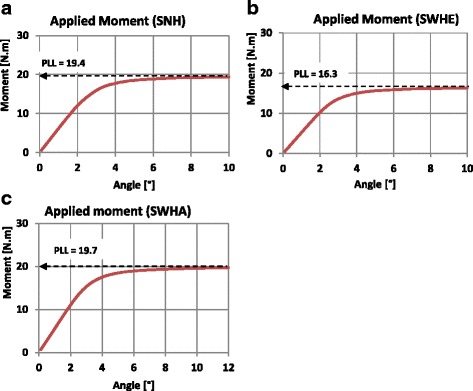
Determination of PLL: Nonlinear load–displacement diagrams. Only the curves from the 3D FEA (case study H) are shown here. a Specimen SNH, b Specimen SWHE, c Specimen SWHA

Determination of PLL: Nonlinear load–displacement diagrams. Only the curves from the 3D FEA (case study H) are shown here. a Specimen SNH, b Specimen SWHE, c Specimen SWHA