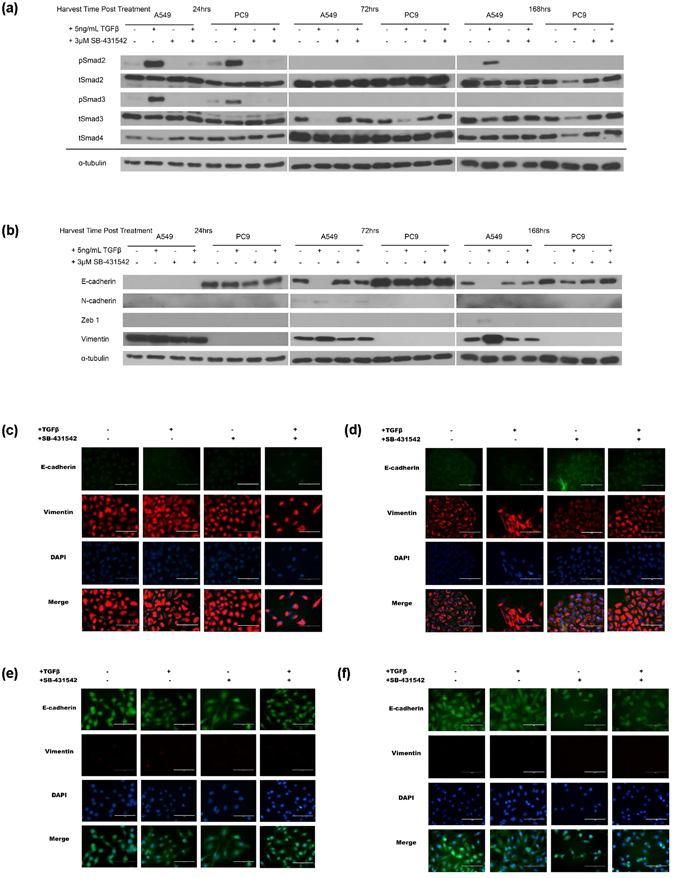
Figure 2.

Total Smad expression, Smad activation and EMT program marker expression varies with TGFβ or inhibitor treatment. A549 and PC9 cells were plated, treated and harvested as described. Proteins were visualized by western blotting. α-tubulin levels are representative controls. (a) Profiling of Smad family member expression and activation across time demonstrates changes in TGFβ canonical signalling. (b) EMT protein markers demonstrate program initiation and progression among treatment conditions. (c) A549 cells treated for 24 hours for E-cadherin and Vimentin expression by immunofluorescence (d) A549 cells treated for 7 days for E-cadherin and Vimentin expression by immunofluorescence (e) PC9 cells treated for 24 hours for E-cadherin and Vimentin expression by immunofluorescence (f) PC9 cells treated for 7 days for E-cadherin and Vimentin expression by immunofluorescence.
