Figure 1.

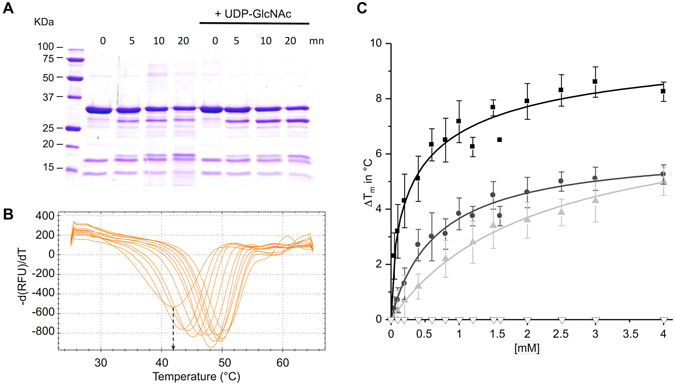
YvcK binds to UDP, UDP-Glc and UDP-GlcNAc. (A) Coomassie-stained SDS-PAGE of YvcK partial proteolysis profile. YvcK was incubated with Trypsin (Promega) in the absence or in the presence of 1 mM UDP-GlcNAc for 0, 5, 10 or 20 min at 37 °C. The digestion profiles were assessed by electrophoresis in 12.5% SDS-PAGE. Full-length gel is presented in Supplementary data. (B) Thermal Shift Assay (TSA) in the presence of increasing concentrations of UDP-GlcNAc. YvcK melting profiles were monitored in the presence of increasing concentration of UDP-GlcNAc (0 to 4 mM). One curve corresponds to data obtained for one concentration of UDP-GlcNAc. The melting temperature of the protein (Tm) is obtained at the midpoint of the each melting curve and corresponds to the minimum of the negative derivative curves (see the arrow that indicates the Tm of YvcK in the absence of UDP-GlcNAc). The Tm is an indicator of protein stability and is increased by the addition of UDP-GlcNAc (Tm = 42 °C in the absence of UDP-GlcNAc and Tm = 50.5 °C in the presence of 4 mM UDP-GlcNAc). (C) TSA results for the binding of UDP, UDP-Glc, UDP-GlcNAc and Glc-NAc. Assays were performed in the presence of increasing concentrations of ligands (0 to 4 mM). The difference of temperature (the shift of Tm induced by the presence of ligand) was plotted against the concentration of UDP (black circle), UDP-Glc (grey triangle), UDP-GlcNAc (black square) and Glc-NAc (white triangle). All the curves correspond to the average of data from at least 3 independent experiments and the standard deviations are representated by the error bars. Curve fitting was performed by using Microcal Origin 5.0 software.
