
Figure 5.
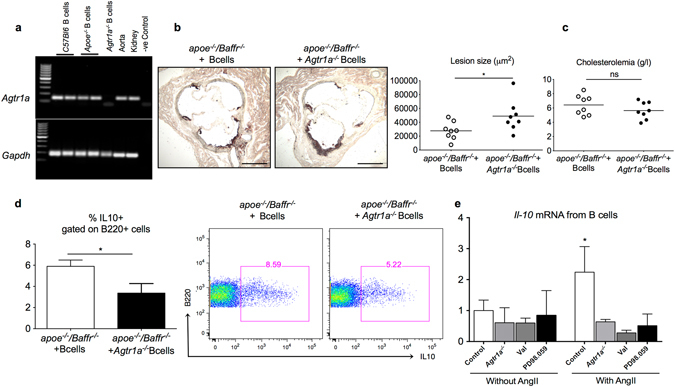
Agtr1a deficiency in B cells accelerates AngII induced atherosclerosis in B cell replenished Apoe −/− /Baffr −/− mice. (a) Agarose gel picture depicting Agtr1a gene expression in C57BL/6J WT, Apoe −/− and Apoe −/− /Baffr −/− B cells and lack of expression in Agtr1a −/− B cells. Aorta and kidney samples were used as positive control. (b) Representative pictures (left) and quantitative lesion assessment by Oil Red O staining in the aortic sinus (right) and plasma cholesterol levels (c) of Apoe −/− /Baffr −/− mice replenished with Agtr1a +/+ or Agtr1a −/− B cells and infused with AngII for 28 days. n = 8 mice per group. (d) Quantitative analysis (left) and representative dot plots (right) of intracellular IL10 staining gated on splenic B220+ cells of Apoe −/− /Baffr −/− mice replenished with Agtr1a +/+ or Agtr1a −/− B cells and infused with AngII for 28 days. n = 8 mice per group. (e) Quantitative measurements of Il10 mRNA in isolated C57Bl6 or Agtr1a −/− B cells treated in vitro in the presence or absence of AngII with or without pre-treatment with valsartan or PD98.059, antagonists of Agtr1a and ERK pathway, respectively. N = 4–6 per treatment condition and pooled data from 2 independent experiments. *p < 0.05, ns denotes non significance. Scale bar 200 μm.