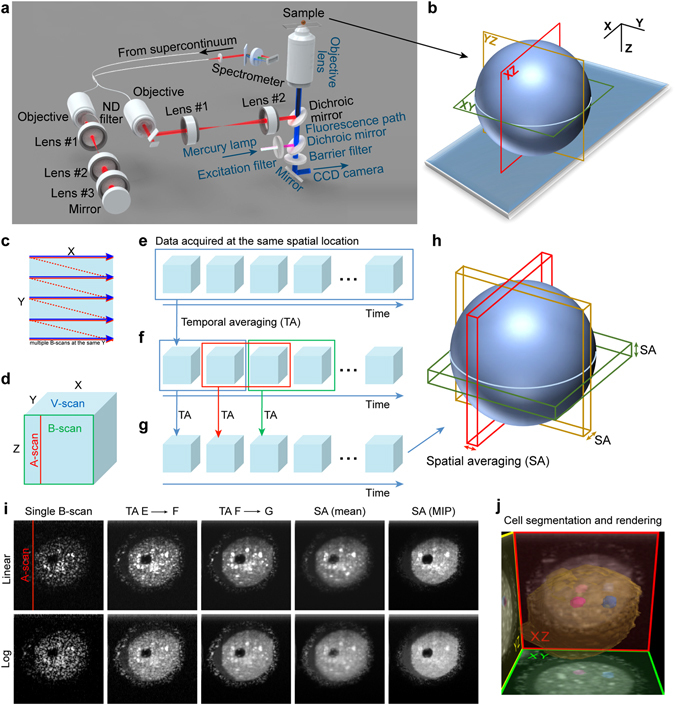
Figure 1.

The OCM system and experimental layout. (a) Imaging setup: the original parts of the inverted microscope are marked in blue and custom OCM parts in black. (b) Schematic of image cross-sections obtained with the OCM setup. (c) OCM beam trajectory in the XY plane. Solid line: the beam trajectory during data acquisition. Dotted line: the beam trajectory between Y positions. (d) Schematic of the data volume acquired in a single OCM measurement. The A-scan is a single image line obtained from one OCM data acquisition. The B-scan is a single image generated from the A-scans. The V-scan is generated from the B-scans acquired at different Y positions. (e–g) Stages of the diversified time interval scanning protocol (DTIsp). (e) Several V-scans are acquired within ~1 sec and undergo temporal averaging. (f) The averaged V-scans from (e) were acquired continuously with a time span ranging from ~20–600 sec for periods of tens of hours. (g) Temporal averaging (TA) was performed on the averaged V-scans from (f) to obtain images with reduced speckle noise. (h) Optional spatial averaging (SA) over thick slices of the averaged V-scan. Different types of averaging are possible, including intensity averaging (mean), minimal or maximal intensity projections (MIP). (i) Images from consecutive steps of DTIsp processing. Linear intensity mapping allows for a better visualization of the cytoplasmic features, while logarithmic - of the nuclei. (j) Cell segmentation and rendering.
