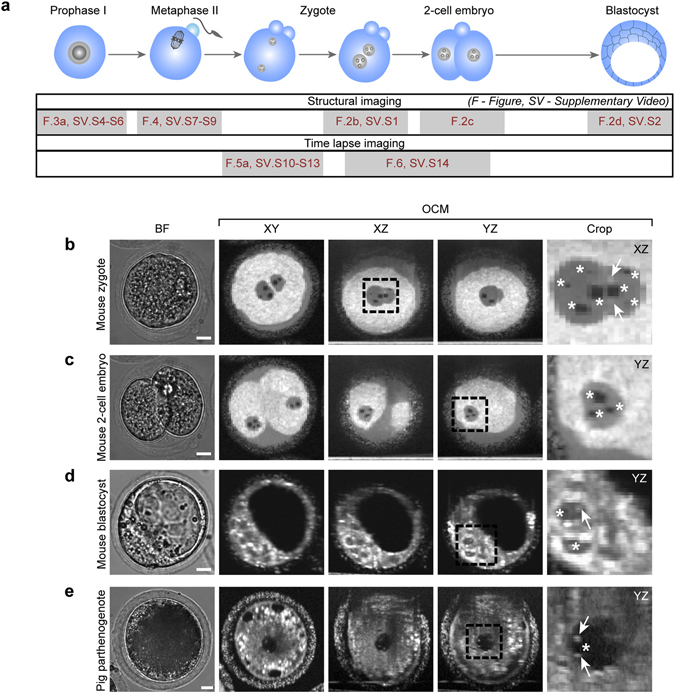
Figure 2.

Embryos and their nuclear architecture visualized by OCM. (a) Stages in oogenesis and embryonic development subjected to OCM scanning. At some stages only intracellular structures were visualized (structural imaging in a single time-point), in other – both the structures and the dynamics of cellular processes such as pronuclei formation and movement or cell divisions were imaged (time-lapse imaging). (b–e) Pronuclei and nucleoli in a mouse zygote (b), 2-cell embryo (c) and blastocyst (d), and in a porcine 1-cell embryo obtained by parthenogenetic activation of an oocyte (e). BF – bright field images. OCM images of mouse zygotes and 2-cell embryos (DTIsp #3 protocol) were processed with the minimum intensity projection over 15 μm (Procedure #2). The mouse blastocyst was imaged using DTIsp #3 protocol without spatial averaging (Procedure #1). OCM images of a porcine embryo (DTIsp #2) are shown without spatial averaging (Procedure #1). Asterisks indicate the nucleoli, arrows - specular light reflexes visible in the nuclei that label the nucleoli. Cropped regions are encircled with a dashed line. Scale bars represent 20 μm. See also Supplementary Videos S1–S3 and S14 for more images of these cells.
