
Figure 5.
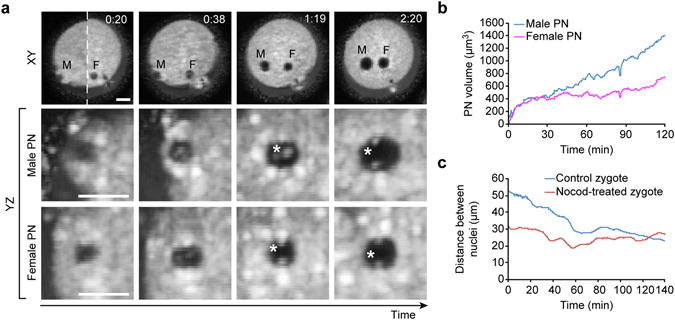
Formation and movement of zygotic nuclei visualized by OCM. (a) Formation of male (M) and female (F) pronuclei in mouse zygotes. OCM images (XY plane) selected from the time-lapse recording obtained with DTIsp #4 protocol are presented using minimum intensity projection of 15 μm-thick slices (Procedure #2). Pronuclei cropped in YZ plane from the same time points as the XY projections are shown without intensity averaging (Procedure #1) and reveal formation of nucleoli (marked with asterisks). (b) Changes in the pronuclei volume were measured with OCM for 2 hrs, with 30 sec intervals between the acquisition of each 3D dataset. Each 3D dataset was automatically segmented using custom algorithms to extract the voxels belonging to pronuclei and to calculate the volume and position of each pronucleus. A gradual increase in volume of both female and male pronucleus is clearly visible. (c) Changes in the distance between pronuclei recorded in control and nocodazole-treated zygotes. Zygotes were filmed for 2.5 hrs, with 30 sec intervals between the acquisition of each 3D dataset. Recordings started at approximately the same moment after fertilization, as judged by morphological markers of the post-fertilization events (i.e. presence of the fertilization cone – a protrusion above the sperm chromatin, and formation of the second polar body). The initial position of nuclei in control and nocodazole-treated zygotes was different (the initial distances were 50 and 30 µm respectively) due to the different sperm entry-point. In control zygotes the distance between pronuclei clearly decreases over time, whereas in nocodazole-treated zygotes it stays the same. Scale bars represent 20 µm. See also Supplementary Videos 11–14 for more images of these cells.