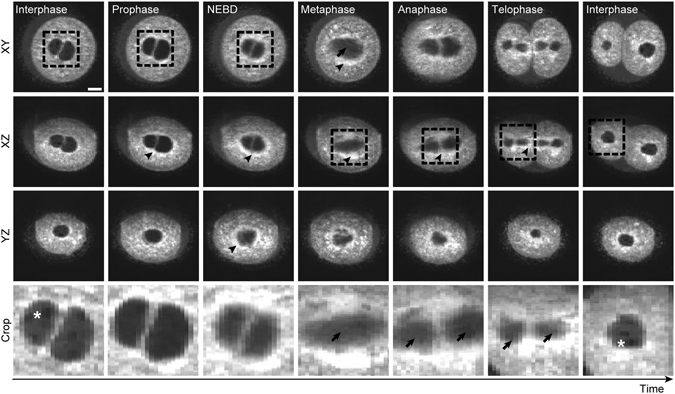
Figure 6.

The first embryonic division visualized by OCM. Mouse zygotes were subjected to OCM time-lapse imaging DTIsp #5 protocol for 13.5 hrs with 120 s intervals between the acquisition of each 3D dataset. Panels present OCM minimum intensity projections of 15 μm thick slices (Procedure #2) selected from the time-lapse recording, showing main events during the first embryonic division: disappearance of nucleoli (in prophase), nuclear envelope break-down (NEBD), formation of the metaphase spindle (metaphase), segregation of chromosomes (anaphase, telophase) and formation of new nucleus with nucleoli (interphase - the last panel). Asterisks indicate the nucleoli, arrows - the microtubular parts of the spindle, arrowheads - a ring formed by membranous organelles (probably ER and mitochondria) around the nuclear apparatus and the spindle during the cell division. Cropped regions are encircled with a dashed line. Chromosomes are not visible with this type of spatial averaging. Scale bars represent 20 µm. See also Supplementary Video S14 for more images of these cells.
