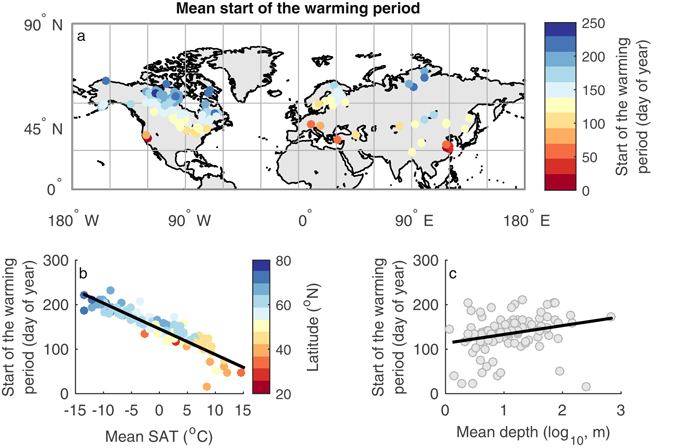
Figure 1.

(a) Average first day of year in which lake surface water temperature (LSWT) persistently exceeds 4 °C (“start of the warming period”), and its relationship with (b) annual mean surface air temperature (SAT) and (c) lake mean depth. Colours in panel (b) signify latitude. Linear regressions of the statistically significant (p < 0.05) relationships are shown. The map was generated using the MATLAB mapping toolbox43 (URL-https://www.mathworks.com/products/mapping.html).
