
Figure 1.
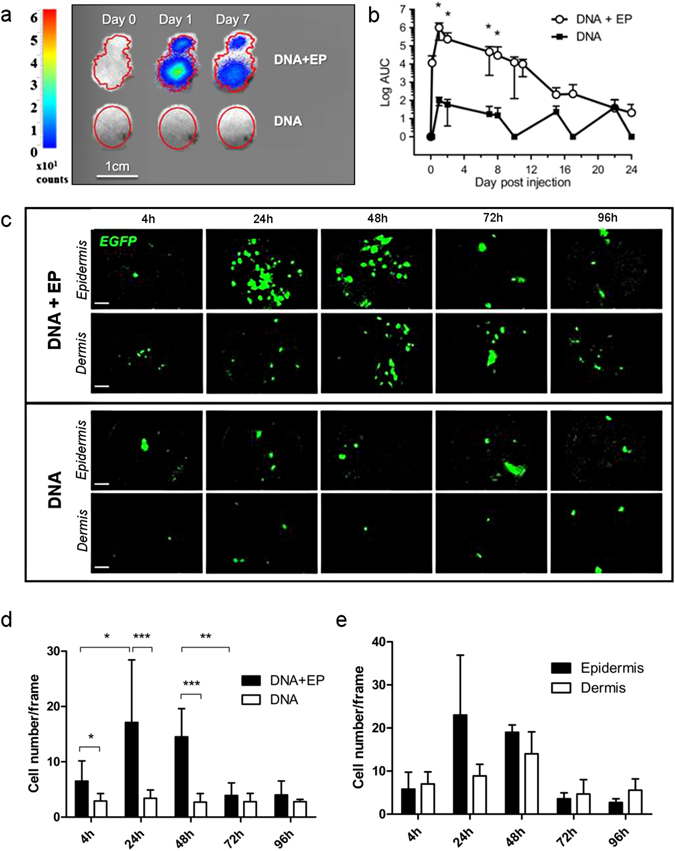
In vivo imaging of vaccine antigen expression at the site of injection. (a) Representative in vivo bioluminescent images of luciferase expression in macaque skin at day 0, 1 and 7 after intradermal injection of auxoGTU®-luc-EGFP ± EP. (b) Quantification of luciferase expression after vaccination with (n = 10) or without electroporation (n = 3). Mann-Whitney test. (c) In vivo fibered confocal microscopy showing EGFP expression by auxoGTU® in the epidermis and the dermis after vaccination ± EP. Scale bar: 100 µm. (d) Quantification of EGFP+ cells from 4 to 96 h after vaccination, from 10 different frames. Paired and unpaired t-test. (e) Distribution of EGFP+ cells in the epidermis and the dermis after DNA vaccination with electroporation. Data are presented as mean ± SD; *p < 0.05; **p < 0.01; ***p < 0.001; EP, electroporation.