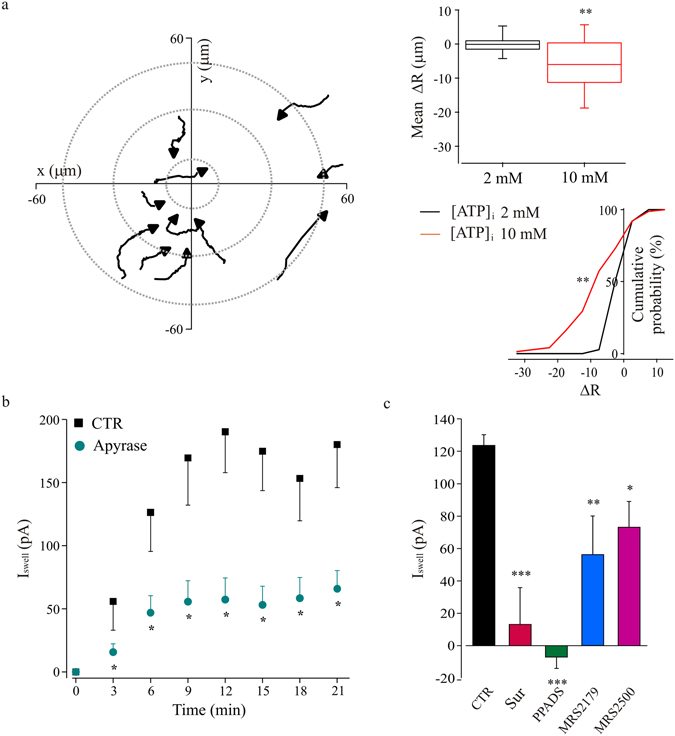
Figure 5.

Microglia swelling currents activation requires purines release and P2R activation. (a) Microglia processes recruitment after ISwell activation in patch clamped microglia in acute hippocampal slice. Left: tracking of microglia processes movement in respect to the recorded cell, dialyzed with 10 mM ATP containing pipette solution, during hypotonic stimulation. Graph origin corresponds to the recorded cell (x = 0, y = 0); gray dotted lines define concentric areas with increasing radial distance. Each trace corresponds to a single process, with black arrows indicating the movement direction. Right, upper panel: bar chart representing the mean displacement of microglia processes during extracellular hypotonic stimulation, evaluated in respect to cells recorded with a pipette solution containing 2 mM (black box; ΔR = 0.005 ± 0.477 μm, n = 37 processes) or 10 mM (red box; ΔR = −6.31 ± 0.97 μm, n = 75) of ATP. **p < 0.01, t-test. Right, lower panel: cumulative distributions of microglia processes ΔR, under extracellular hypotonic stimulation, with a pipette solution containing 2 mM (black line) or 10 mM (red line) ATP. **p < 0.01, Kolmogorov-Smirnov test. (b) Time course of swell-activated currents evoked with the chronic hypotonic protocol, and recorded in control condition (n = 9; black squares) and in slices treated with apyrase (20 U/ml; n = 11; cyan dots; *p < 0.05, t-test). (c) Effects of purinergic receptors blockers on the swell-activated current amplitude. Bar char represents the amplitude of currents recorded in control condition (black, n = 18), in presence of suramine (500 μM, red, n = 4), PPADS (100 μM, green, n = 4), and two different blockers of P2Y1 receptor, MRS-2179 (100 μM, blue, n = 5) and MRS-2500 (1 μM, magenta, n = 10). ISwell was evaluated after 12 minutes of hypotonic stimulation (MP = + 50 mV). *p < 0.1, **p < 0.01 and ***p < 0.001 vs control; one-way ANOVA, Holm-Sidak.
