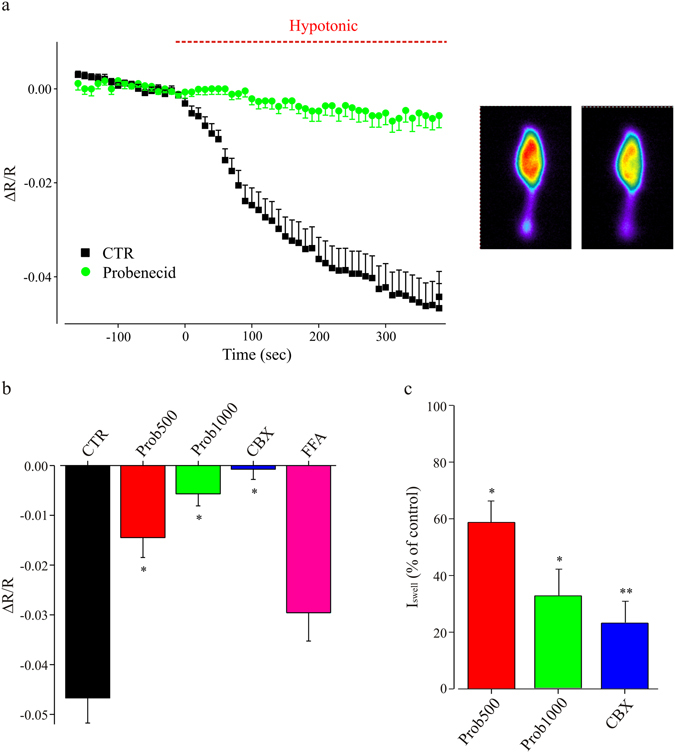
Figure 6.

Cell swelling induces ATP release from microglia cells. (a) Left, time course of the fluorescence ratio obtained by the acute exposure of BV-2 cells transfected with a FRET-based ATP sensor, to an hypotonic extracellular solution (205 mOsm, red bar) in absence (black; n = 31) or in presence of probenecid (1 mM, green; n = 16; p < 0.05 at 5 minutes of hypotonic medium application); right, representative fluorescence images of a transfected BV2 cell, in normotonic condition (left) and under hypotonic stimulation (right); notice the decrease in fluorescence ratio, indicating a reduction in [ATP]i. (b) Bar chart representing the fluorescence ratio evaluated in ATP-sensor transfected BV-2 cells, in response to hypotonic medium (200 mOsm; 5 minutes of application) in the absence of blockers (CTR, black, n = 31) or in presence of probenecid (500 μM, red, n = 24; 1 mM, green, n = 16) or CBX (100 μM, blue, n = 13) or FFA (pink, n = 31). *p < 0.05 vs CTR, one-way ANOVA, Holm-Sidak. (c) Bar chart showing ISwell in slices treated with probenecid (500 μM or 1 mM) or CBX (100 μM), expressed as percentage of the current amplitude in internal controls (recorded in the same experimental days in untreated slices). Probenecid 500 μM: red; n = 13 vs n = 5; **p < 0.01, t-test. Probenecid 1 mM: green, n = 9 vs n = 5; **p < 0.01, t-test. CBX: blue; n = 6 vs n = 4; **p < 0.01, t-test. ISwell amplitude as in 5c. Statistics were performed on raw amplitude values.
