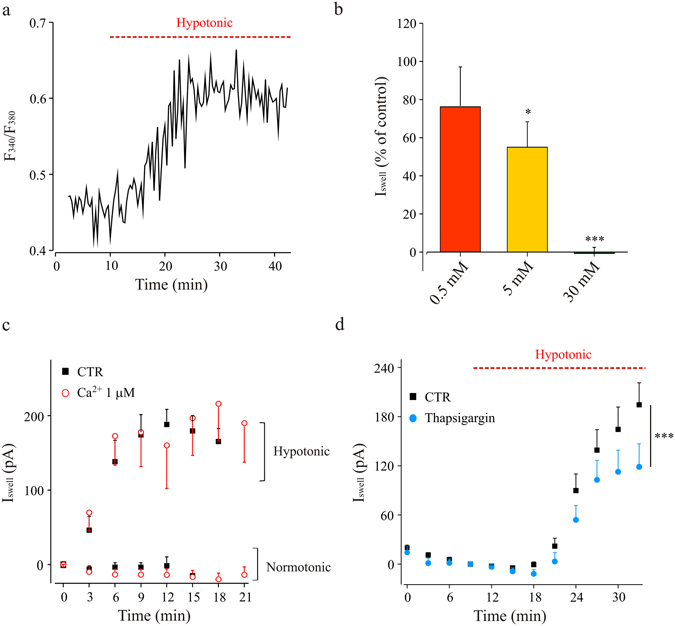
Figure 7.

Intracellular Ca2+ increase is necessary for the hypotonic-induced current activation. (a) Representative trace of intracellular Ca2+ increase in a Fura-2-loaded (100 μM) microglia cell, recorded in hippocampal slices under acute hypotonic stimulation (red bar, 8–10% dilution). (b) Bar chart of ISwell amplitude measured in presence of BAPTA 0.5, 5 and 30 mM in the pipette solution, expressed in percentage (see 6c). Internal controls were recorded in the same experimental days with EGTA 0.5 mM in the pipette solution. BAPTA 0.5 mM: red; n = 9 vs n = 9; p = 0.4, t-test. BAPTA 5 mM: yellow; n = 14 vs n = 25; p < 0.05, t-test. BAPTA 30 mM: green; n = 6 vs n = 8; p < 0.001, t-test. Iswell amplitude as in 5c. Statistics as in 6c. (c) Time-course of ISwell amplitude recorded in control conditions (black squares, CTR) and with 1 μM free [Ca2+]i, (red circles) in the pipette solution, under normotonic or hypotonic extracellular stimulation, as indicated. Notice that, high [Ca2+]i was unable to activate ISwell (red circles, n = 6; p = 0.3 vs CTR, black squares, n = 8) in the absence of hypotonic stimulation, or to modulate it under hypotonic stimulation (red circles, n = 5; p = 0.5 vs control, black squares, n = 11). (d) Time course of ISwell recorded with control pipette solution (n = 9; black) or containing thapsigargin (1 μM; n = 13; blue). ***p = 0.001, two-way ANOVA, Holm-Sidak.
