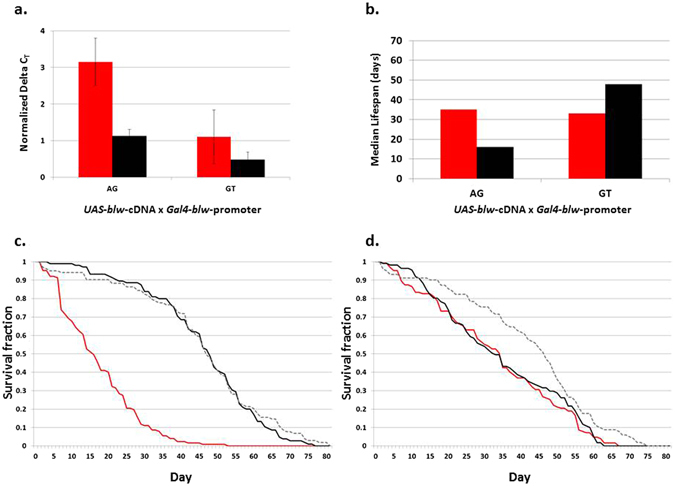
Figure 3.

Effect of blw-cDNA overexpression on lifespan. (a) Normalized expression levels measured by quantitative RT-PCR of blw-cDNA when driven by the blw-AG and blw-GT promoters (red, females; black, males). (b) Median lifespan of flies that overexpress blw-cDNA from the blw-AG and blw-GT promoters (red, females; black, males). (c) Survival curves of male flies overexpressing blw-cDNA when driven by either the blw-AG (red) or blw-GT promoter (black). (d) Survival curves of female flies overexpressing blw-cDNA when driven by either the blw-AG (red) or blw-GT promoter (black). The control flies expressing the endogenous blw gene are shown by gray dotted lines.
