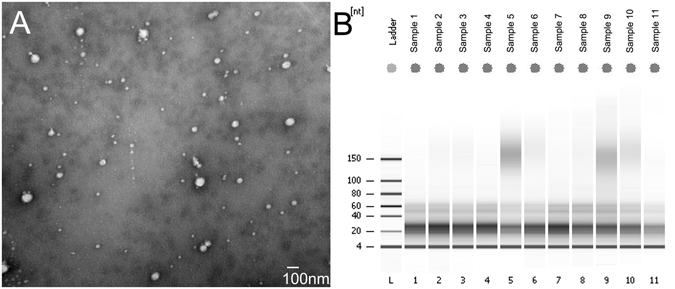
Figure 1.

Plasma exosomes and their RNA sizes. (A) Scanning electron microscopy revealed the phenotype of the exosomes isolated from plasma. Exosomes isolated with ExoQuick were fixed and processed with STM. The bar represents 100 nm. (B) Exosomal RNAs determined by small RNA chip. A total of 50 μL exosome solution from 250 μL plasma was subjected to RNA extraction. The column binding RNA was resolved in 14 nuclease free water. One microliter of the RNA solution was added in the small RNA chip and processed with Bioanalyzer 2100. Shown is the representative gel electrophoresis map.
