
Figure 2.
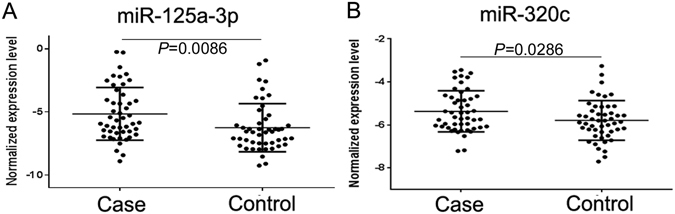
Expression levels of the miRNA candidates in the CRC patients and the healthy controls. A total of 3ng miRNA was reverse transcribed using QIAGEN miScript II RT kit. After 1:10 dilution, two microliters of cDNA template were used for quantification by real-time PCR. MiR-30e-5p was used as internal control. Relative expression levels of miR-125a-3p (A) and miR-320c (B) in the CRC patients (Case) and healthy controls (Control) are shown.