
Figure 3.
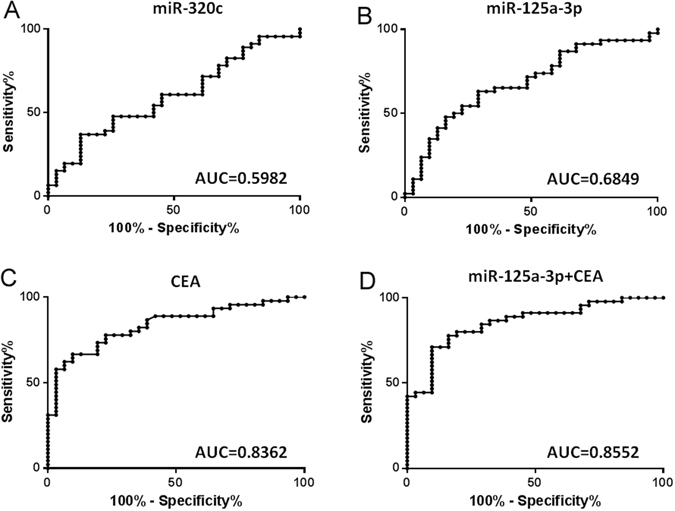
Diagnostic power of each tumor marker determined by ROC curve. Serum level of CEA and the expression level of miR-320c and miR-125a-5p were respectively stratified into high and low group with their geometric mean as cut-off. The performance of miR-30c (A), miR-125a-3p (B), CEA (C), and miR-125a-3p plus CEA (D) yielded area under the ROC curve (AUC) values of 0.5982 (P < 0.1459), 0.6849 (P = 0.0156), 0.8362 (P < 0.0001), and 0.8552 (P < 0.0001).