
Figure 3.
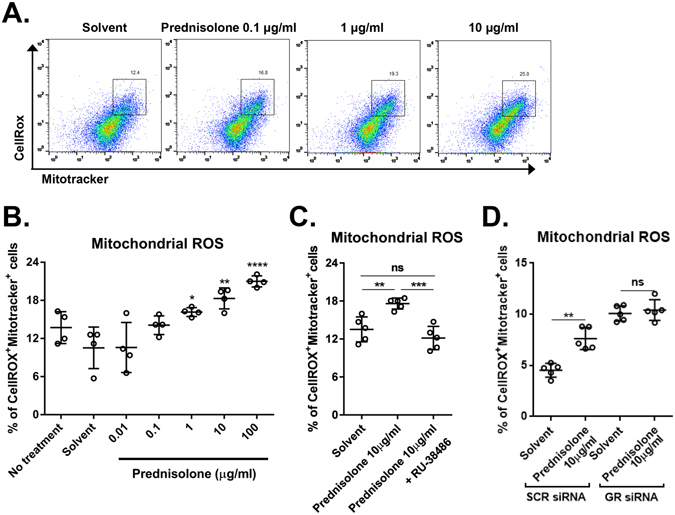
Effects of prednisolone on mitochondrial reactive oxygen species (ROS). (A) Representative flow cytometry plots for hCECs after staining with CellROXTM Deep Red and MitoTracker Green dyes. (B–D) Quantitative flow cytometry results for CellROX+MitoTracker+ cells as a measure of mitochondrial ROS in hCECs treated with prednisolone. The glucocorticoid receptor (GR) antagonist RU-38486 was added to some cultures (C). The mitochondrial ROS was also measured in hCECs transfected with GR siRNA or control SCR siRNA (D). Data are presented as mean ± SD from at least four independent experiments. *p < 0.05, **p < 0.01, ***p < 0.001, ****p < 0.0001, ns: not significant.