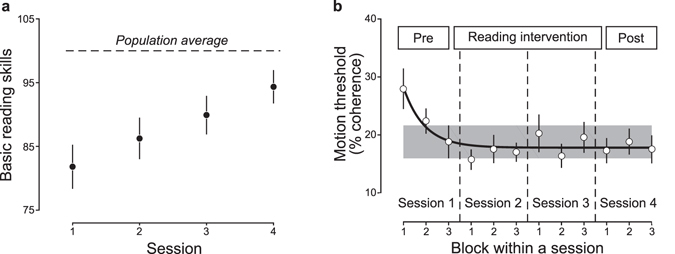
Figure 2.

Intervention improves reading skills but not motion sensitivity. (a) Intervention effects. Reading skills improved significantly during the reading intervention. Reading skills are plotted as a function of time in the intervention (circle). The population average (50th percentile) reading score is shown for reference. (b) Motion processing learning effects. Motion discrimination threshold (percent coherence) is plotted as a function of experimental block. Subjects completed three blocks during each measurement session. The black line is the best-fitting exponential decay function to the data. The shaded area is ± 1 SEM of the mean threshold in block 3 of session one (pre-intervention). Thresholds decline over the first three blocks as the subjects learn the task and then reach a stable level with no change over the intervention. Error bars represent ± 1 SEM across subjects.
