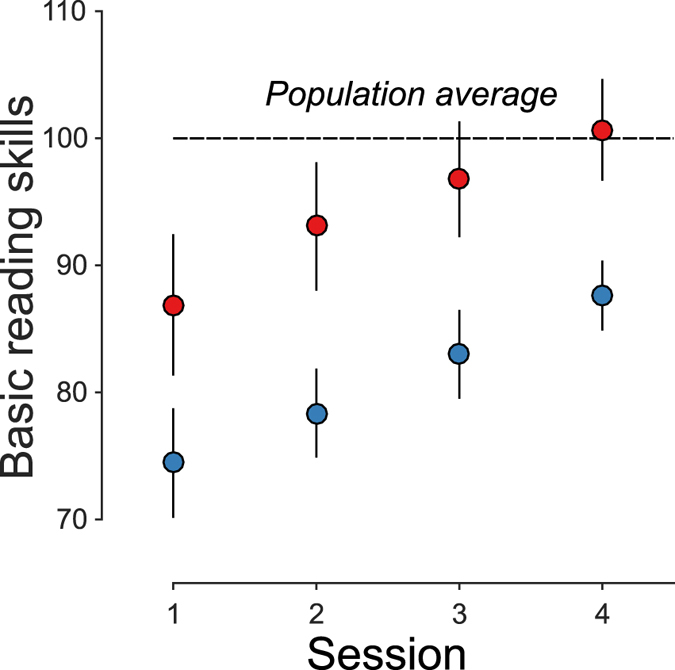
Figure 3.

Response to intervention is equivalent for subjects with low and high motion sensitivity. Reading skills (y-axis) are plotted at each time point for the low motion sensitivity group (blue) and high motion sensitivity group (red). The error bars are 68% bootstrapped confidence intervals (Cis). Mean growth rate and bootstrapped 95% CI (CI95) were 4.47 (CI95 = 2.11 to 7.22) for high motion sensitivity group versus 4.40 (CI95 = 2.44 to 6.58) for the low motion sensitivity group. Both groups showed similar improvements over the intervention.
