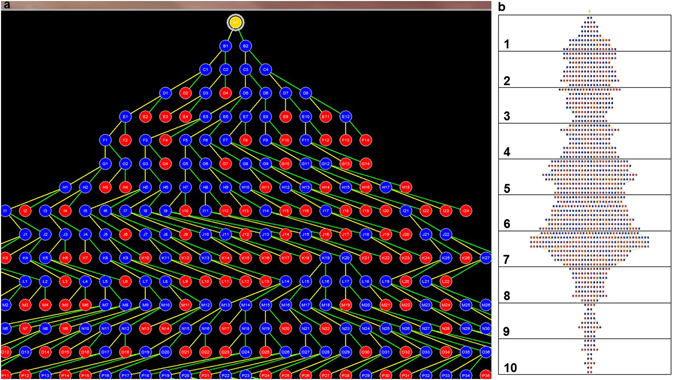
Figure 3.

Vessel tree maps generated on Analyze. Panel (a) is a screenshot showing part of a tree map of vessels. The yellow dot at the top represents the root of all the vessels (umbilical cord insertion point). True branch points and terminal branch points are marked in blue and red dots respectively. Each point is labelled with alphabets designating the branch generation/level and numbers designating the branch number at each level. Panel (b) shows a sample tree map grouped into decile (ten groups) of branching. In this example, the total level of branching (excluding the root) was eighty. This was divided into ten groups containing eight levels each. The number of branches in each group was counted.
