Figure 5.

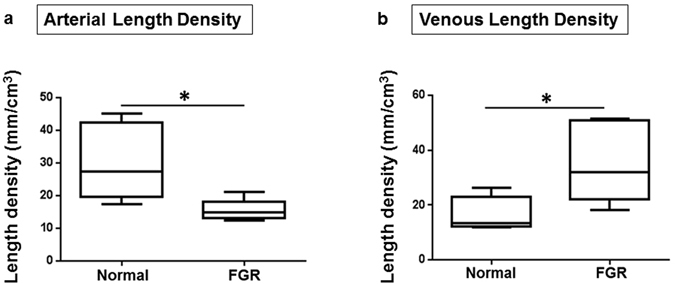
Arteries are shorter and veins are longer than normal in FGR casts. Panels a and b represent (a) the arterial length density and (b) venous length density respectively. Compared to normal casts, arterial path was significantly shorter in FGR (a). However, the converse is true for the venous network (b). Data presented as boxplots showing the median, range and interquartile range. n = 12 normal (6 arterial, 6 venous) and 12 FGR (6 arterial, 6 venous) casts. Mann Whitney test, *marks two-tailed p vaule = 0.009 and 0.03 in a and b respectively.
