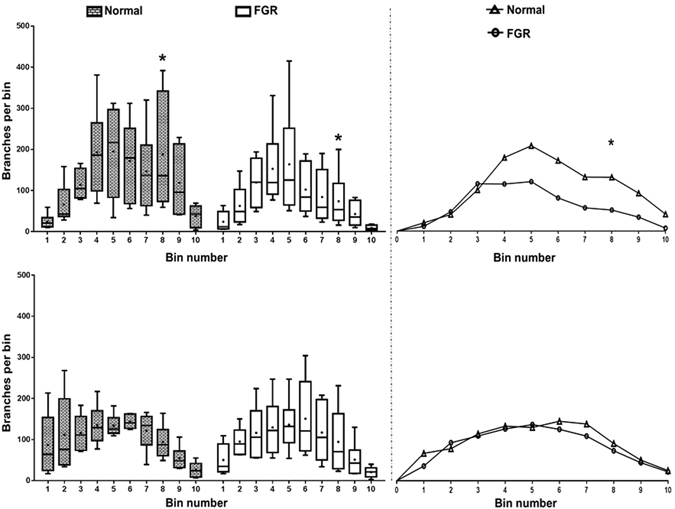
Figure 6.

The number of branches in each of the ten bins in the tree maps. Graphs represent arterial (top left) and venous (bottom left) tree maps. Line and dots within the boxes represent the median and mean respectively. There are significantly fewer branches in the FGR arterial trees around the level of the 8th bin of branches compared to normal while there is no difference in the number of branches in the venous trees. Curves on the top and bottom right represent the relationship between the median number of branches in the arterial and venous trees respectively. There is a trend suggesting fewer number of branches in the 4th–10th bins of branches in the FGR arterial trees (top right). This trend is absent in the venous trees (bottom right). Data presented as boxplots showing the median, range and interquartile range. n = 12 normal (6 arterial, 6 venous) and 12 FGR (6 arterial, 6 venous) casts. Two-way RM Anova with Sidak’s multiple comparison test, alpha value = 0.05, *marks two-tailed p value = 0.002.
