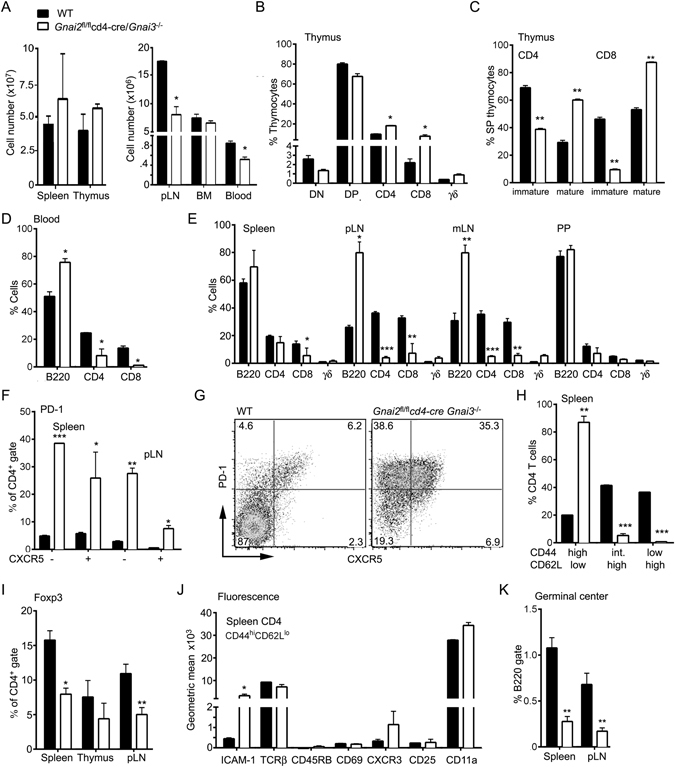
Figure 3.

Consequences of deleting Gnai2 in DP thymocytes of mice that lack Gnai3 on T cell development and distribution. (A) Cell numbers in different lymphoid compartments. Number of cells in the lymphocyte gate. (B) Distribution of thymocyte subsets as assessed by flow cytometry. (C) Distribution of mature and immature SP CD4 and CD8 thymocytes. (D) Distribution of lymphocytes in the blood. (E) Distribution of lymphocytes in spleen, peripheral lymph node (pLN), mesenteric lymph nodes (mLN), and Peyer’s patches (PP). Axillary and inguinal lymph node cells were pooled in the pLN analysis. All visible PP were pooled for the analysis. (F) PD-1 and CXCR5 expression on CD4 cells from spleen and pLN of indicated mice. (G) Flow cytometry pattern of PD-1 versus CXCR5 expression on spleen CD4 cells from WT and DKO mice. (H) CD44 and CD62L expression on spleen CD4 T cells. (I) Percentage of Foxp3 CD4 T cells in the spleen, thymus, and pLN. (J) Comparison of indicated cell surface markers on CD44hiCD62Llo splenic CD4 T cells. Data presented as a geometric mean. (K) Distribution of germinal center B cells in spleen and pLNs. % of B220 positive cells that express high levels of FAS, GL7, and low levels of CD38. Data represents the analysis of a minimum of 3 mice of each genotype repeated at least three times. *p < 0.05, **p < 0.005 and ***p < 0.0005 (Student’s t-test).
