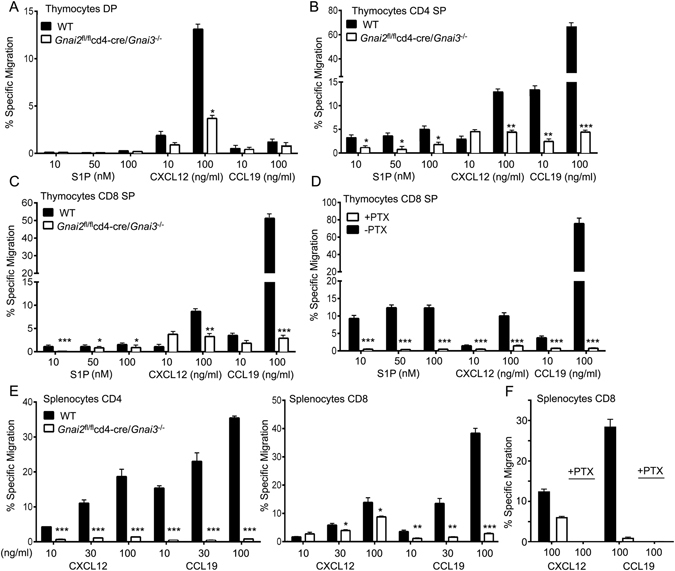
Figure 4.

Analysis of migratory capacity of thymocytes and T cells from DKO mice. (A–C) Chemotaxis assays with increasing concentrations of S1P, CXCL12, and CCL19 as indicated. Shown are the percentages of DP (A), CD4 SP (B), and CD8 SP (C) thymocytes that specifically migrated. (D) Chemotaxis assays with increasing concentrations of S1P, CXCL12, and CCL19 as indicated. Shown are the percentage of CD8 SP thymocytes either pre-treated with pertussis toxin (PTX), or not, that specifically migrated. (E) Chemotaxis assays with increasing concentrations of CXCL12 or CCL19 as indicated. Shown are percentages of CD4, CD8, and PTX toxin treated CD8 cells that specifically migrated. Results are 4 mice of each genotype done in duplicate. *p < 0.05, **p < 0.005 and ***p < 0.0005 (Student’s t-test).
